Iconographic Tracking:
Method Overview and Tutorial
Iconographic tracking is a digital research method that accounts for the rhetorical transformation that images undergo as they circulate and become embroiled in various collective activities. As Gries describes in detail elsewhere (see Gries 2013, 2015, 2017), iconographic tracking is a constellation of research methods that entail the following strategies:
- Data hoarding (collecting as much data as possible)
- Assembling a collection (organizing data)
- Data mining (sorting through data and finding patterns, trends, relationships, etc)
- Data analysis (zooming in on an image's composition, production, transformation, distribution, circulation, collectivity, and consequentiality)
- Tagging and coding data (generating metadata about genre, media, location, date of publication, rhetorical function, etc.)
- Data visualization (using digital visualization techniques to generate inquiries, new lines of research, trends, patterns, and insights)
Such research strategies are especially useful in helping to trace an image's distributed collective activities and generate a complex ontological account of how images circulate and become rhetorical with time and space.
Iconographic tracking is, in actuality, a messy recursive research process, so the strategies do not necessarily unfold in the linear order identified above. But to help make the method of iconographic tracking as transparent as possible, we offer the following step-by-step guidelines.
Additionally, the final section of this tutorial applies iconographic tracking methods to a new object of study: the "Distracted Boyfriend" meme. The videos narrate an iconographic tracking research process and offer two tutorials demonstrating how to code for genre and create visualizations of the resulting patterns and trends. Whereas Gries tends to rely on Google Spreadsheets and Zotero for iconographic tracking, Bowers' videos model how Atlas.ti can also help to organize, code, and create data visualizations. We invite you to adapt iconographic tracking for your own research methods and to hone the method using different software.1
Iconographic Tracking: Step-by-Step Guidelines
By Laurie E. Gries
- Phase I: Collecting Data
- Create a research journal for your work.
- Journal: freewrite what you know about the image you have chosen to track. Identify what you assume about who produced it, for what reasons, and what rhetorical functions you think it has played. Write down everything that you know about this image. Identify words/terms/names that you associate with the image, which you can use to create key search terms and get your research started.
- Download Zotero on your computer and make sure you know how to capture screen shots of the websites on which you find the image you are tracing. Zotero has a function to help you do this.
- Type key search terms from journal entry into Google Images. Play with different key terms if your original search terms are yielding no findings.
- Each time you find a website or social networking site with the image, use Zotero to take screen shot. BUT VERY IMPORTANT: Do not linger on the websites nor even read the material on those websites. Simply locate the image and save website link to Zotero via screen shot. Look at and save as many websites as possible.
- Research Phase II: Assembling Data
- Once you have collected a good amount of data, go back and access all the websites you found via Zotero. Now read through all the websites, data mine, and analyze data just enough to be able to identify patterns in consequences, collective actions, trends, locations, etc.
- Create Folders in Zotero. Title Folders with Names that reflect the patterns and trends you discovered.
- Organize data by dragging website links to particular folders.
- Journal: identify what key search terms you used and what each yielded. Identify initial observations gained through data mining process and how you settled on Zotero folder titles. Note your initial response to research findings, but make no interpretations and perform no deep analysis. Simply respond. VERY IMPORTANT: Identify how you might narrow research if you think this is necessary and develop new research inquiries that have emerged and you would like to explore. Invent new search terms as you discover unknown relations between the image and various associations that you want to research. Write them down in your research journal so you can remember to use them in next research phase.
- Research Phase III: Diversifying and Expanding Your Research Collection
- With new search terms in mind, conduct research via social media sites, image sharing sites, and editorial photographic services to find more instances in which the image has appeared: TinEye, Twitter, Flickr, AP Images, Getty Images, and Reuters, etc.
- Use other visual search engines, perhaps, even on different computers to avoid filter bubbles. Play with new search terms, as needed, based on your research findings.
- After collecting new data, data mine, and organize new data via Zotero. Generate New Folders as need be.
- Journaling: If you think it might help, note what images and key search terms you used in specific visual search engines and what each yielded. Explain how you settled on new Zotero folder titles. This will help you keep a record of your own research process.
- Research Phase IV: Analyzing and Triangulating Data
- Now that you have collected and organized a mass amount of data, go back and read carefully through ALL the information in your files. Take note of the image’s transformations across genre, media, and form. Also, identify and investigate the collective activities in which an image has become embroiled, what diverse functions it has taken on, and what consequences might have been sparked from such rhetorical activity. Write down all your discoveries in your journal.
- Also in your journal, generate a list of questions that interest you about the image’s collective activities and identify any key designers, actors, people who you might contact for an interview or send a questionnaire to in order to find answers to your questions.
- Conduct interviews, questionnaires, surveys, and other qualitative methods to learn more about the image’s collective activities and to triangulate data.
- Journal: once you receive responses from your interviews and questionnaires, write down in your journal what you discovered. Note down any tensions, contradictions, surprises, and other relevant information that you will discuss in your case study.
- Conduct more research as necessary to find answers to new questions that were generated by interviews and questionnaires. Create and conduct new interviews and questionnaires if necessary.
- If more digital research is necessary, begin assembling and organizing data again, adding data to Zotero files as needed.
- Research Phase V: Tagging, Coding and Visualizing Data
- Finish analyzing any new data collected during Phase IV.
- Journal: continue to develop insights into the phenomena at play and zoom in on the exact findings that are of most interest to you.
- Develop a tagging and coding method to help you generate metadata about your research findings based on your own research interests. Example: Tag date, location, designer, media, source of URL where image documented, copy image address. Code for function, genre, consequentiality.
- Use data management apps such as Google Sheets to host, format, manage, collaborate on, visualize, and publish data.
- Through Google Spreadsheet Charts and/or other appropriate software, create visualizations (such as Geographical Maps, Bubble Maps, Bar Graphs, Time Series Graphs, Frequency Charts, etc.) to help you find patterns and trends and generate new questions for continued or related research.
- Based on your analysis of data, draw new and/or confirm prior assumptions and claims about data in your journal or continue research going back to different research phases as need be.
NOTE: Phase V of the research process may require collaborating with a computer programmer if you are not familiar with data formatting and visualization strategies. You might also consult textbooks such as Visualize This: The Flowing Data Guide to Design, Visualization, and Statistics by Nathan Yau to learn how to present and visualize data in useful ways. For a list of useful data visualization tools, see http://www.creativebloq.com/design-tools/data-visualization-712402.
PLEASE ALSO NOTE: This method has been specifically designed to empirically account for the circulation, transformation, and distributed collective activities of images. However, it can be adapted to trace other media artifacts as well as concepts, slogans, etc. Please adapt this method for your own research and/or teaching needs.
Video Tutorials for Phase V of Iconographic Tracking
By Kristina Bowers
The following tutorial models Research Phase V of iconographic tracking. This tutorial relies on a sample data set titled the "Distracted Boyfriend" meme to demonstrate how to code for genre and create visualizations of the resulting patterns and trends. This meme originated from a stock photo taken in 2015 in Gerona, Spain by photographer Antonio Guilliam. Originally titled, “Disloyal Man with His Girlfriend Looking at Another Girl,” this object-labelling meme typically communicates a value judgement, or preference, of one thing/person/idea v. another thing/person/idea. This meme, referred to as the DB meme below, is useful for this tutorial due to its popularity, virality, and the sheer number of remixes that can be found across the Internet. For further reading on the origin of this meme, see Brian Barrett’s 2017 article about this meme in Wired.
In this tutorial, Atlas.ti--rather than Zotero--is used to tag, code, and organize images. Atlas.ti’s visual interface enables researchers to code directly onto images and to create diverse visualizations such as network maps.
This tutorial—a two part video—explains how to (1) organize your image data in Google Sheets, (2) generate metadata about these images, (3) upload your images into Atlas.ti, (4) tag/code the images with metadata, and (5) create visualizations using code data. I've taken advantage of the Wayback Machine to archive both the webpage and the image jpeg url. This process is necessary in order to archive data in the event of a loss or corruption of original data. It is also beneficial to have this data available for future use by other researchers and scholars.
In this tutorial, I code specifically for genre. Below, you can view a table of the images in my data set including the original stock photo and resulting iterations/remixes that constitute the meme. The majority of the remixes in this set use the original stock photo as the base, adding on to or changing text labels, while a few depict humans or toys recreating the poses of the actors in the original stock photo.
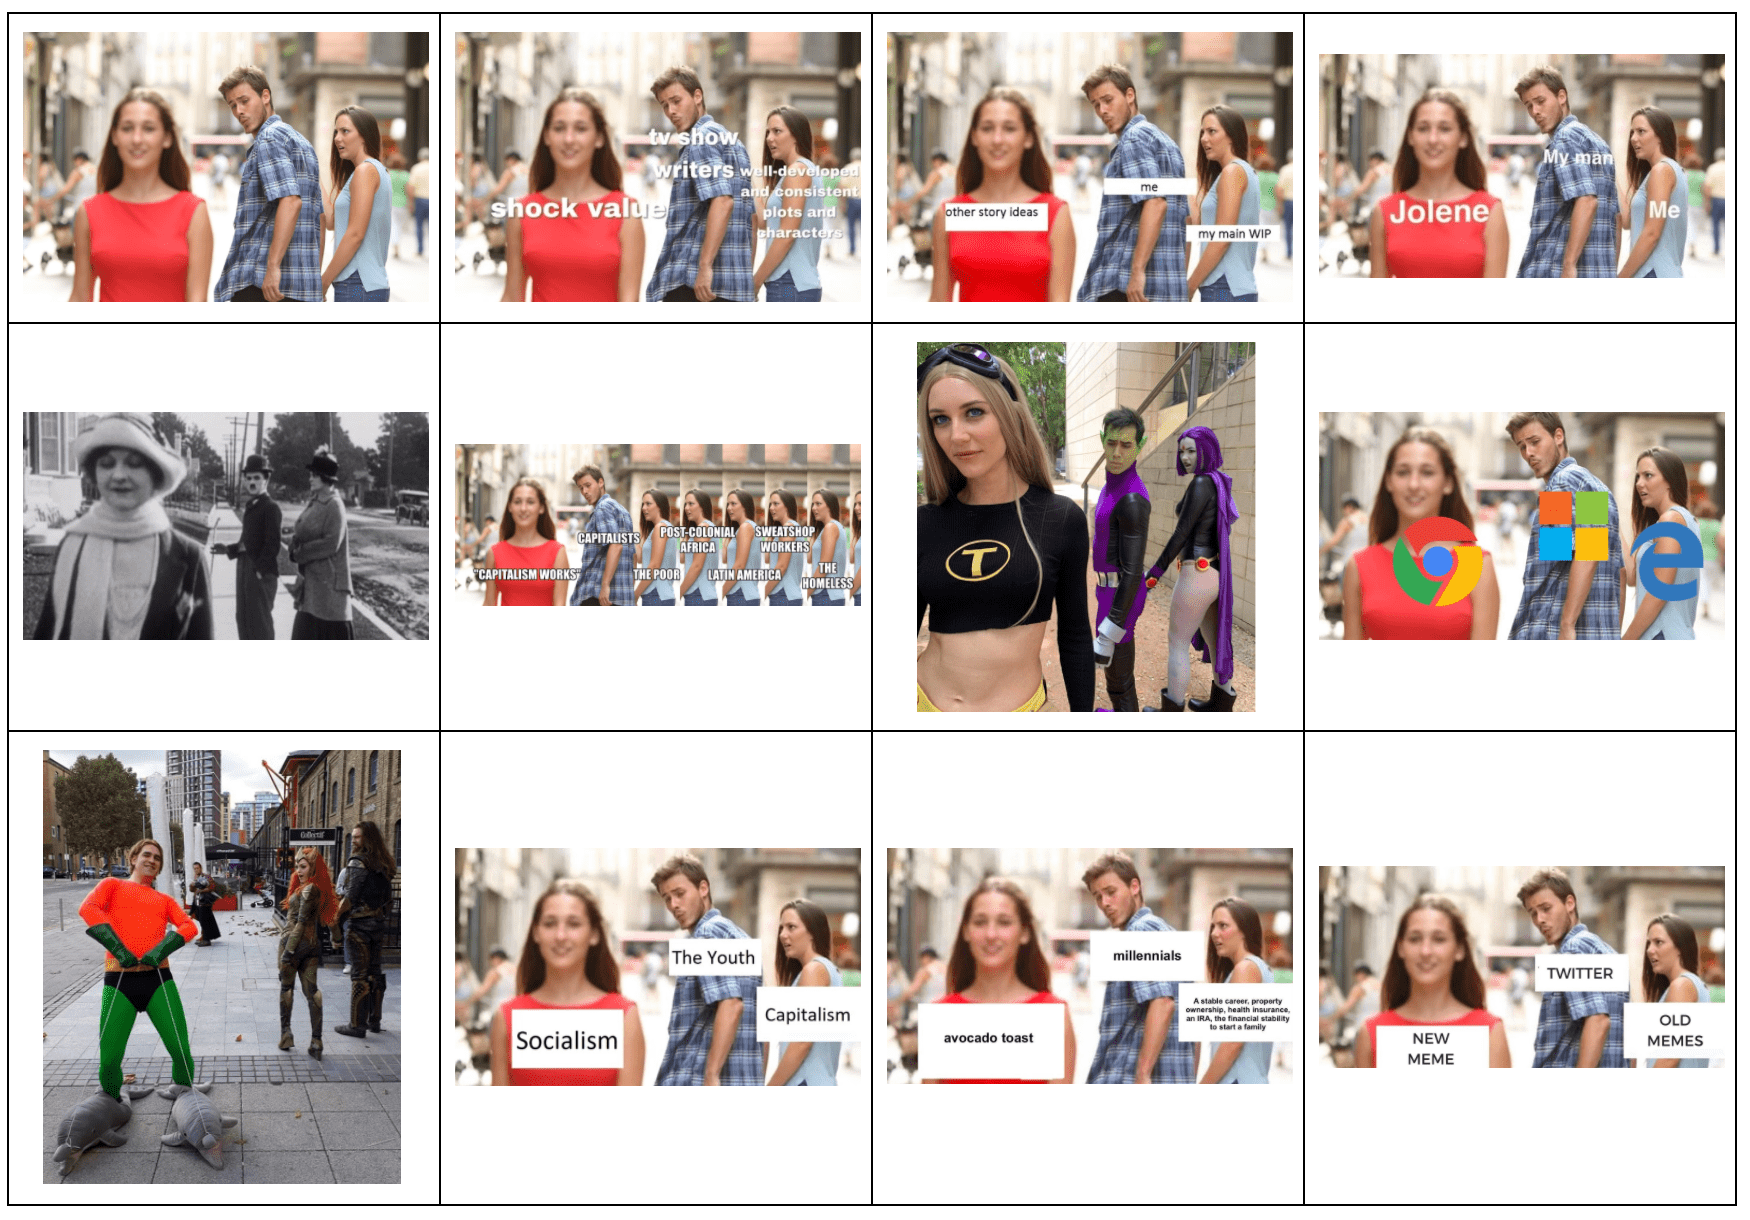
Figure 1. Remixes of the “Distracted Boyfriend Meme” Images 1–12.
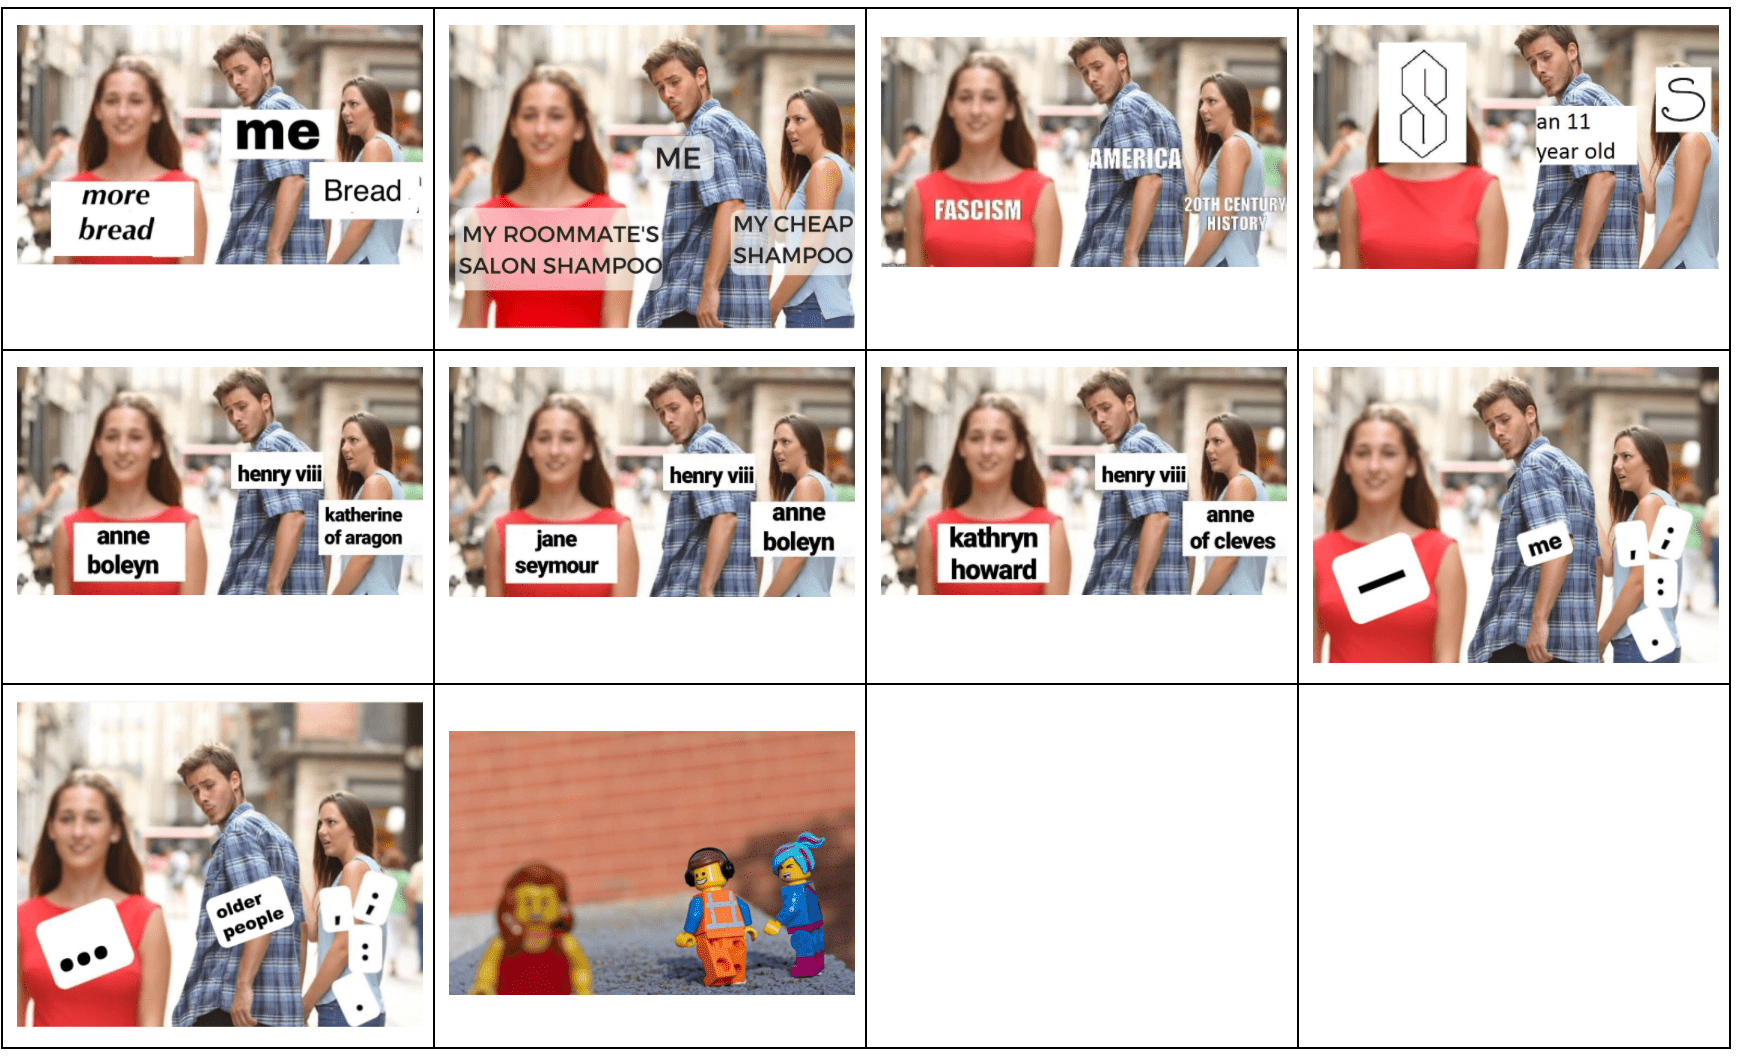
Figure 2. Remixes of the “Distracted Boyfriend Meme” Images 13–22.
Using Google Sheets and Atlas.ti to Create Metadata for Image Collection
This section demonstrates how to move from data collection to coding to visualization, as described in Research Phase 5 above. To follow this tutorial with your own collection of images, you should have already completed research phases I - IV as detailed above as well as completed the steps below.
- Download Atlas.ti to your computer (https://atlasti.com/). Alternatively, you can access the program remotely through a higher education institution or workplace. In the video tutorials, I use Citrix Workspace to view the program remotely with my university credentials.
- Save your image files/data set locally on your computer. I have numbered my image files with an acronym “DB” for “Distracted Boyfriend” followed by a number. I have used a relatively small data set for the purposes of this tutorial, although it’s likely you will have a larger data set in multiple containers (folders).
- Along with saving your data set locally, upload your images to a Google Drive folder (or multiple for larger data sets). Name image files in Google Drive identically to my local files.
- Create a Google Sheet to organize image metadata. I have created the following metadata categories as column headers:
- Location
- Form
- Media
- Genre
- Function
Video 1: Research Phase V of Iconographic Tracking (Part 1).
To view captions in the above video, use the "CC" button on the embedded video player. A downloadable transcript of the interview is also available (docx and pdf).
Video 2: Research Phase V of Iconographic Tracking (Part 2).
To view captions in the above video, use the "CC" button on the embedded video player. A downloadable transcript of the interview is also available (docx and pdf).
1. We also invite you to share your own strategies with Gries by emailing her at Legries@colorado.edu.↩