Introduction
As a first-year civil engineering major enrolled in Introduction to Engineering, her very first engineering course, Alexandra Griffith (a pseudonym) found herself immersed in what Winsor (1996) described as the work of “turning physical reality into convincing written data” (p. 105). Much of that work involved her writing the kinds of project proposals, reports of design projects, and PowerPoint presentations typically documented in studies of writing and learning for engineering (Artemeva, 2005, 2009; Beaufort, 2007; Selzer, 1983; Winsor, 1996, 2003). More routinely, though, Alexandra’s work for engineering, like Terri’s work as a nurse, found her navigating the cascade of inscriptions, including tables, lists, charts, and graphs, that animate literate activity in the STEM fields (Goodwin, 1994; Hutchins, 1995; Latour, 1987, 1990, 1999; Latour & Woolgar, 1986; Lynch, 1988; Poe, Lerner, & Craig, 2010; Roth, 2003; Wickman, 2010). Knowing how to create, act with, and transform inscriptions, an ability Johri, Roth, and Olds (2013) referred to alternatively as “inscriptional fluency” and “representational fluency,” is not only necessary to successfully accomplish engineering work, but also “to develop an identity as an expert within the engineering workforce” (p. 3).
In this brief video clip (below) we have composed from one of our interviews, Alexandra explains her creation and use of some of the dozens of inscriptions she and her three teammates employed during the capstone design project for Introduction to Engineering. Intended to offer students authentic engagement with engineering activity and practice, the four-week collaborative project asked small groups of students to design a paper airplane that both performed well and was cost-efficient to mass produce, and then present their results in a written report and a formal oral presentation with an accompanying PowerPoint.
Figure 1
Table from Alexandra's Engineering Class Project
(Click to Enlarge)
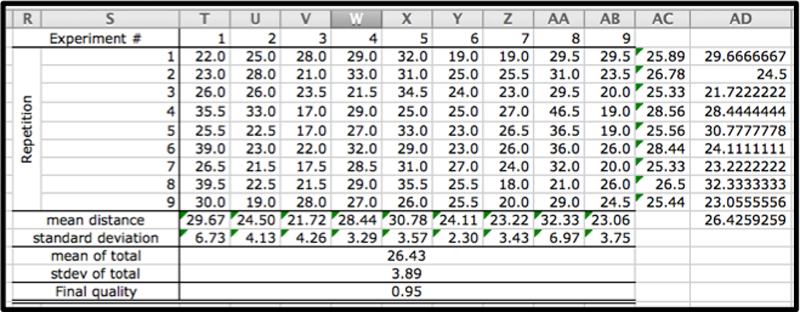
The table that Alexandra gestures over as she talks about making and flying the planes (see Figure 1 at left), for example, represents the distance of each of the flights for each version of the plane and the mean and standard deviation (the measure of the amount of variation) of those distances. Alexandra and her teammates will use these data to determine the flight performance of each version of the plane in terms of distance and consistency, and, ultimately, to select which versions of the plane to manufacture and sell.
Figure 2
Table from Alexandra's Engineering Class Project
(Click to Enlarge)
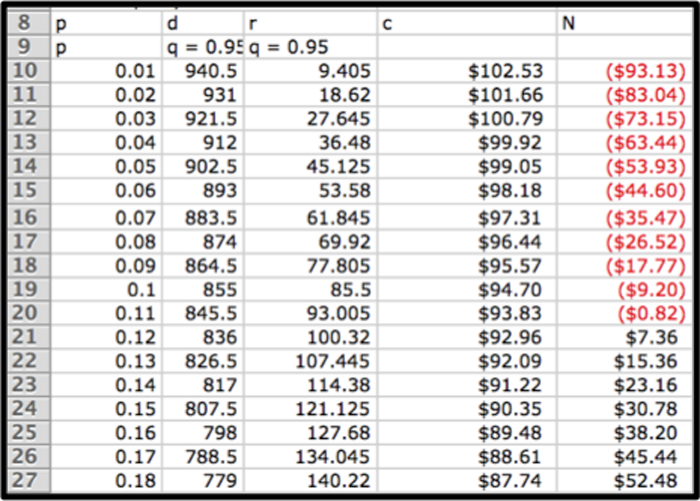
The other table Alexandra mentions represents (see Figure 2 at right) quantities for the sale price (p), demand (d), rate of manufacture (r), cost of production (c), and net profit (N) of a particular version of the airplane. Alexandra and her teammates will use data from different columns of this table to generate a series of x and y line charts (as she demonstrates during the latter portion of the video) representing the relationship between these factors, and, ultimately, to select the versions of the plane most profitable to produce.
Even though this was Alexandra’s first undergraduate engineering course, and the first course for which she worked so extensively with data in Excel tables, she displays considerable competence with designing, interpreting, using, and talking about these tables in ways expected of and valued by engineers. Her abilities did not go unnoticed by her peers. According to Alexandra, her facility with Excel tables prompted her teammates to refer to her as the team’s “Excel chart person” very early in the semester. In short, Alexandra demonstrates a considerable degree of what Johri, Roth, and Olds (2013) referred to interchangeably as “representational fluency” and “inscriptional fluency,” the ability to use, transform, and create representations and inscriptions (p. 3). Understanding the development of Alexandra’s fluency with tables as an engineer-in-the-making is the focus of this chapter.
Alexandra’s use of tables in ways valued by engineers situates her in the densely textual landscape of engineering processes and practices. And yet, like the previous co-researchers whose focal disciplinary activities located them along an extensive historical trajectory reaching across their literate lifeworlds, it also locates her along a historical trajectory of literate action that stretches beyond the assumed borders of engineering and into a number of her other textual engagements. In this chapter, we trace Alexandra’s acting with tables as it is semiotically remediated across those multiple streams of literate activity. As in the previous chapters, the trajectory we trace argues for a more dispersed, complexly mediated, and heterogeneously situated understanding of disciplinary writing, learning, and socialization.
Ultimately, we argue that Alexandra’s facility with tables in ways valued by engineers has developed along a lengthy and dispersed historical trajectory of repurposing across multiple activities including playing video games, scheduling her life’s activities, writing fan novels, and solving logic puzzles. As a result, her acting with tables for the engineering project is accomplished through a densely laminated assemblage of texts and textual activities.