Mining Hope:
Preserving and Exploring Twitter Data for Digital Visual Studies
Conclusion: Future Explorations
To end, we want to return to a point we made earlier about how data science methods not only lend insights to the visual artifacts themselves, but also how they help us to better understand the networks in which the artifacts circulate. While it may take some time—and serious methodological work—there are very tangible ways we can begin contributing to the work of studying the networks themselves. We can start by paying better attention to how data is used in digital networks, how the data affects algorithms and filtering programs, and how all of this may sometimes work in unintended ways—allowing bots, click farms, and other manipulative efforts to sway massive networks, with millions and billions of users. This is no small problem, but small efforts could make a big difference in combating and reducing some of the manipulative forces. Instagram is already testing the effect of removing likes2 from their platform, and Instagram believes this could result in people focusing more so on genuine interactions with users/content—rather than focusing too much on the number of likes an image receives.
Just as some data sources are paired down—as with the like button—others are continuing to expand in their influence and utility for digital networks. Emoji are one such data source, and they are quickly displacing the affective binary of like/dislike. By allowing for a much broader range of affective visual response, emoji replicate the efficiency of the one-click like/dislike, but they also enable a much broader range of responses—allowing for far greater affective resolution. While a sizeable portion of digital data remains either the alphabetic text produced by humans or the metadata attached to (or created by) digital artifacts, emoji are quickly becoming the standard for analyzing the attitudes and emotions that contribute to the reception and circulation of digital media.
Kellie Gray’s research makes a significant contribution to the study of emoji in digital networks—and to the study of the networks themselves—as she identifies key problems facing scholars who are interested in understanding the rhetorical impact of emoji. In addition to her full length dissertation on the subject—as well as her forthcoming article examining the function of emoji “as a form of multimodal public rhetoric”—Gray’s work shows how many of the programs designed to collect data from social media either fail to include emoji in-line with alphabetic script as originally composed, fail to include modifiers applied to specific emoji (such as skin tone or gender), or fail to include the emoji altogether. While these problems persist, emoji are becoming increasingly relevant as they facilitate new types of hybrid global communication. It is difficult to deny the emerging cultural and linguistic significance of emojis, but there are currently no research tools available that facilitate the broad scale research of emoji use within/across multiple digital networks. Thanks to Gray’s work, the NEH has funded the MassMine team to develop workable solutions to these (and other) problems for researchers, and Gray is a funded contributor and co-Pi on the project.
We want to finish this conclusion with another observation of our own—an observation that, like Gray’s discovery about the problems with emoji data—we also discovered when collecting data about digital artifacts. As MassMine’s original data source, Twitter continues to provide a reasonable amount of access to free data for academic research, and they have shown a willingness to be more transparent about how they moderate the content in their network. Yet, there is a limit to the amount of transparency Twitter provides.
This limited transparency brings us back to the example of Eunsong Kim’s “The Politics of Trending,” and the fact that we are no longer able to replicate Kim’s methods. In addition to Apple purchasing and closing down Topsy, there is second reason why it is no longer possible to replicate the results of Kim’s research: Twitter no longer allows it. Twitter’s newest terms of service—which were likely revised in response to tools like Topsy—reads as shown:
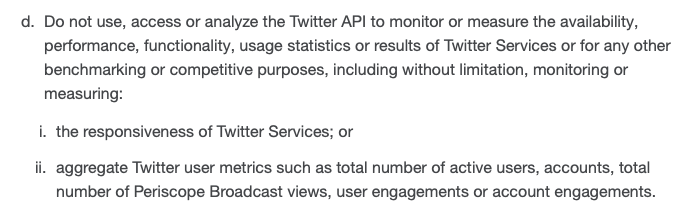
Figure 3. Sceen capture of Twitter developer rules.
Figure 3 is a screencapture of Twitter’s developer rules from July 2019, and it shows how Twitter now explicitly blocks the use of data from their API for benchmarking or testing the effectiveness (“responsiveness”) of Twitter as a network. In other words, Twitter blocks the use of their proprietary data—data that they received for free from users who post on their network—and if those same users want to aggregate that data to test the effectiveness of Twitter, that is explicitly prohibited. Twitter’s developer rules stops users from aggregating their data and testing whether or not Twitter—or Twitter’s advertisers—are overtly manipulating the content circulating in trends and user feeds.
Kim’s own experiences with Twitter, as identified in “The Politics of Trending,” stands as an important example for reconsidering the long-term sustainability of our research practices more generally, but more specifically, it encourages us (1) to develop our own tools and data-driven technologies, (2) to learn how to apply a wider range of exploratory and descriptive statistical methods, and eventually, (3) to learn how to study the networks themselves—at scale. It’s not certain, of course, whether learning to apply the exploratory and descriptive methods of data science will actually help improve the actual networks. But we should try; as the underlying technologies of digital networks shift and change, so too do the possibilities for effective digital persuasion. If we are to have any agency over the future of digital networks, an important first step is working to better understand the business models that build and sustain digital technologies, as well as coming to terms with the tools, methods, and methodologies that enable us to study the networks themselves and the digital (visual) artifacts that circulate within them. As we consider the legacy of Shepard Fairey's iconic Obama Hope poster—and, just the same, the legacy of viral digital artifacts more generally—we hope that readers are motivated to study the pollutants and unintended consequences that continue to emerge from this shift, while also acknowledging the immense potential for data-driven methods and methodologies in keeping pace with the massive scale of digital visual artifacts in circulation today.
2. Blake Hallinan--author in this collection--has produced an entire dissertation, dedicated to the like button.↩
Works Cited
Balkan, Aral. Beyond The Camera Panopticon | Re:Publica. 2015, https://youtu.be/jh8supIUj6c.
Beveridge, Aaron. “Circulation Analytics: Research Software Development and Social Network Data.” Circulation, Writing, and Rhetoric, edited by Laurie Gries and Collin Gifford Brooke, Utah State UP, 2018, pp. 243–61.
---. “Looking in the Dustbin: Data Janitorial Work, Statistical Reasoning, and Information Rhetorics.” Computers and Composition Online, no. Fall 2015, Jan. 2015, http://casit.bgsu.edu/cconline/fall15/beveridge/.
Dignan, Larry. “Twitter’s Q4 a Mixed Bag of Usage, but Revenue Growth, Data Licensing Solid.” ZDNet, https://www.zdnet.com/article/twitters-q4-a-mixed-bag-of-usage-but-revenue-growth-data-licensing-solid/. Accessed 26 July 2019.
Eunsong, Kim. “The Politics of Trending.” Model View Culture, no. Issue 18, Mar. 2015, https://modelviewculture.com/pieces/the-politics-of-trending.
Graham, Shawn, et al. Exploring Big Historical Data: The Historian’s Macroscope. Icp, 2015.
Gray, Kellie, and Steve Holmes. "Tracing Ecologies of Code Literacy and Constraint in Emojis as Multimodal Public Pedagogy." Computers and Composition, vol. 55, 2020.
Gries, Laurie. “Mapping Obama Hope: A Data Visualization Project for Visual Rhetorics.” Kairos: Rhetoric, Technology, Pedagogy, vol. 21.2, Jan. 2017. kairos.technorhetoric.net, http://kairos.technorhetoric.net/21.2/topoi/gries/index.html.
---. Still Life with Rhetoric: A New Materialist Approach for Visual Rhetorics. Utah State UP, 2015.
Hawley, Rachel. “How this one Font Took over the World.” The Outline. 26 April 2019, https://theoutline.com/post/7356/gotham-font-is-everywhere?zd=1&zi=vncwtpjs. Accessed 20 Dec. 2019.
Hayes-Roth, Aaron. “Apple Shuts down Topsy: The $200 Million Mystery Laid to Rest | LinkedIn.” Linked In Pulse, 16 Dec. 2016, https://www.linkedin.com/pulse/apple-shuts-down-topsy-200-million-mystery-laid-rest-aaron-hayes-roth/.
Horn, Nicholas M. Van, and Aaron Beveridge. “MassMine: Your Access To Data.” The Journal of Open Source Software, Dec. 2016, doi:10.21105/joss.00050.
Jockers, Matthew L. Macroanalysis: Digital Methods and Literary History. U of Illinois P, 2013.
---. Text Analysis with R for Students of Literature. Springer, 2014.
John F. Gantz. Expanding the Digital Universe. IDC, Mar. 2007.
John F. Gantz, and David Reinsel. The Digital Universe in 2020: Big Data, Bigger Digital Shadows, and the Biggest Growth in the Far East. IDC, Dec. 2012.
Martin, Nicole. “Instagram May Be Getting Rid of ‘Likes’ On Platform.” Forbes, https://www.forbes.com/sites/nicolemartin1/2019/04/30/instagram-may-be-getting-rid-of-likes-on-platform/. Accessed 16 Aug. 2019.
Silge, Julia, and David Robinson. Text Mining with R: A Tidy Approach. O’Reilly Media, 2017.
Toffler, Alvin. Future Shock by Toffler, Alvin. Random House, 1970.
Twitter Developer Agreement and Policy. https://developer.twitter.com/en/developer-terms/agreement-and-policy.html. Accessed 26 July 2019.