
Abstract
This response examines what we need to recognize and consider when we approach sliced, aggregated, and/or compiled data.
Introduction
Data science and visualization have a growing interest in rhetoric and composition (Mueller; Gries, "Mapping") and a longer history in professional and technical communication (Kimbell and Kostelnick; Kostelnick and Hassett). Scholarship across writing studies has often been attentive to the slippery definitions of "data" with an eye toward the relationship between "data" and "reality" (see Richard Haswell's definition of "datum," for example). As these conversations permeate writing studies broadly, this relationship becomes a crucial component of how we understand our own work.
Information scientist Christine Borgman has recently characterized data-informed humanities work as marked by ambiguity and situational diversity (184, 27–28). That is, what we consider "data," let alone usable data, results from a process of identifying and curating it for use. For our purposes, a usable definition for "data" would join Borgman's and Haswell's: data are not "natural objects with an essence of their own" but "representations of observations, objects, or other entities used as evidence of a phenomenon" (Borgman 28), evidence of Haswell's "datum," the "act" that a researcher "cannot change" (187). Rhetoric scholars are in a privileged position to critique the epistemic gap between "data" and "datum," and turning toward questions of "futures"—how our work represents truth and creates change—provides an opportunity to do so. Taking stock of how this gap forms, how we address it, and how it influences the futures that result from our research is a necessary step toward more ethical representationality and actionability in our work.
Becoming Data
Literature on the ontologies of data tells us that the data we encounter is never "raw." Lisa Gitelman explicitly claims that data only exists in manufactured forms. Orit Halpern argues that data exists only in relation to its observer, a "cybernetic" relationship (78) that is found in "spaces where representation, practice, technology accumulate—to show things in the world" (37). This reciprocal relationship is further highlighted in the work of those like Tufte, Kostelnick and Hassett, and Knaflic, who approach the practice of presenting data from various aesthetic, rhetorical, and cognitive angles. With such reciprocal meaning-making in mind, we can position ourselves to understand the roots and results of the ambiguities that arise when we encounter data. We can, as many of the scholars in this collection do, accept the social construction of data and address it with varying degrees of explicitness.
The space between observer (or researcher) and data constitutes much of the ambiguity Borgman sees in humanities-based research. The authors in this collection address these ambiguities in discussing their methods. Steve Parks explores ambiguity in his work with Syrians for Truth and Justice, noting the need for a system with which to "vet" collected stories and reflecting on "the conceptual, programmatic and institutional contexts in which [his] professional identity exists." Prior alludes to ambiguities in data collection, too, as he pulls "data" from a range of sources: "life-history, semi-structured, and text-based interviews; formal and informal observations; a collection of texts; . . . historical contextualization of the place of biology in home and community life, and memory." Gries pulls data from reported instances of hate speech, disaggregating by "geographical location," "media," "structure," "intended target," and "individual, community, and institutional responses." In her collection process there's ambiguity in the reliance on third-party reporters as we turn to "becoming and consequentiality . . . [, e]specially in cases in which intentionality is hard to discover." That is, the material situation of iconographic tracking relies on motivated reporters and the parsing of reactions to determine the rhetorical meaning of an act.
In these examples, the ambiguities we find are a result of the uneasy ontology of data. According to Lev Manovich, data we encounter comes in a symbolic form that suppresses narrative in favor of the items that construct it (229–33). Yet data does little rhetorical or argumentative work until narrative or something similar is applied; or, to follow Cole Nussbaumer Knaflic, the texts in this collection illustrate the "importance of context" (19). Each text in this collection that does explicit work with data, critiquing and making sense of data, does so to some degree by applying context to de-contextualized datasets. The forces that determine what and how those forms are applied constitute the ambiguous process of "becoming data." What we encounter in these texts are layered representations of reality, contextualized representations that reflect and sometimes smooth out the ambiguities within. That is, we can approach data with an eye toward the actions taken to prepare it for view: the narrative forms, aesthetic forms, and methods used to present it as a useful illustration of a slice of reality.
Taking stock of the above, we should note some key themes that arise:
- Data is only found in directly or indirectly manufactured forms
- Viewers see data as a product of technological, contextual, and often visual representation
- Data gathers meaning through contextualization first and, second, through interaction with a viewer
Data "becomes" through intervention on and interaction with reality. These interactions are contingent on a series of situational forces, affecting work with data from its recognition as such. Though each text in this collection employs vastly different data sets and vastly different collection and presentation methods, each methodology contributes to data's "becoming," transforming it by contextualizing it. To become data is to become a manufactured representation—of "truth," of a scientist-in-the-making, of rising hate speech, and so on—and to be packaged with these caveats in mind.
"Things Given"
The ontological life of data begins when researchers determine that an event or entity counts as data. This determination is the product of situational and ambiguous forces. As Barnett Pearce and Victoria Chen have done, I lean here on the etymological root of "data"—"things given"—and propose that we reconsider what it means for data to be "given," to imply a "giver" and a mode of delivery, and even to imply a production process that turns an event or entity into a thing to be given.
The determination that something is data is a result of social and situational forces that shape encounters with it. To encounter a data visual such as Gries's map, for example, is to encounter an object formed by social and situational forces that shape encounters with reported hate speech, the decision to track one symbol instead of others, and the decision to visualize these encounters geographically. We encounter a product molded by the situational forces that inform an individual's reaction when encountering hate speech, including whether or not to report it at all, whether to make it "count." In other words, the semiotic nature of data is similar to the "becoming" that Prior writes about here. As data "becomes," it is mediated, laminated, and transactional. Old documents and utterances are mediated by a longer narrative and data are given richer meaning by past, present, and ultimately future events. But in such mediated spaces—where individuals can take something and give it meaning as data—representationality is both gained and lost. Prior's data is packaged in a narrative that tells one story through dispersed events, claiming explicitly the difficulty of "representing participants' lives . . . in a narrow range of settings"; Parks's data is filtered through socio-political circumstances that suppress the narratives of women in Syria, granting that data only partial representationality; The Swastika Monitor, in its nascent stages, represents only a slice of encountered and reported instances of hate speech, seeking greater representationality through public participation.
Questions of how closely data represents "truth" stem directly from the ambiguities of our work: the material, political, and situational forces that attend these projects. Though we largely accept that data is constructed and only partially representative of the realities that underlie it, we should grant fresh eyes to questions of how it is constructed and the results of this constructed-ness in future encounters with it, especially if we are to make our scholarship actionable, impactful, and sustainable for the future.
Ambiguity ↔ Reality
As real situations inform data's presentation, presentation can also influence real, material circumstance. Gries sees this as an opportunity, calling on rhetoric scholars to use their expertise to inform data-driven practices in ways that can effect change via "actionable insights." But because this book is in its own process of becoming, I first turn outside to illustrate how data—and the ambiguities of data—have become "actionable" in specific ways.
My research on the writing of a small non-profit, for example, has led me to the following, subject-produced map drafts:
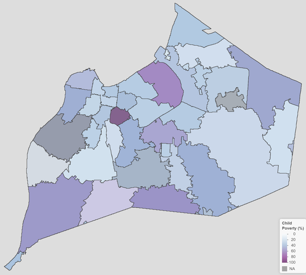
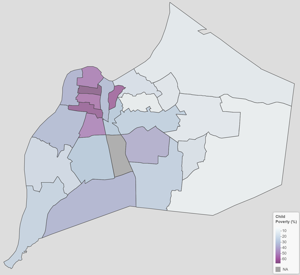
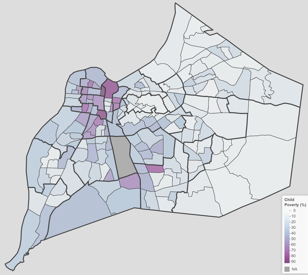
The above maps disaggregate one data set—the childhood poverty rates of a city—three ways. We first see the data disaggregated by zip code; second, it is disaggregated by neighborhood; third, it is disaggregated by census tract with neighborhoods overlaid. These drafts show writers contending with ambiguity—in the data set, in geographic borders, and in the visualization itself. The producers of these maps, ultimately making the third their public-facing model, knew what we as rhetoric scholars can offer in critiquing data use: that the presentation of data includes a claim to knowledge of a slice of reality, and, if the data is declared "actionable," ambiguity in its presentation leads to missed opportunities or misplaced resources. Months after publishing these and other maps, in fact, a food bank was able to pinpoint an underserved tract in what is represented as a small cluster of purple. Had either of the other two models gone public, that food bank would have responded to different geographical representation, shifting east (in the first map) or north (in the second).
As Candice Welhausen notes, maps represent attempts to "establish metaphorical control and ownership over the representation of the space, transforming the space into . . . an object that can be studied and subsequently used for some specific purpose" (268). For Welhausen, a produced context for data constitutes a declaration of ownership over a space and that action can be taken in that space. Yet given the situationally-specific practices that produce ambiguities prior to this event—in encountering, recognizing, collecting, and contextualizing data—such declarations are always made from uncertain ground.
Gries's Swastika Monitor provides a good, albeit speculative, case study of data's uncertainty in action. The interactive map illustrates the ongoing effort to track, catalog, and contextualize incidents of hate speech involving the swastika. However, unpacking the trajectories of becoming that transform the events into data points reveals various ambiguities. One ambiguity arises from sourcing. While iconographic tracking produces rich data sets, it relies heavily on the digitization and reporting of the incident. And once reported—transformed from event to data point—search algorithms (on Google, Facebook) may further promote or depress traffic depending on the source of reporting. Such ambiguities are, of course, driven by forces largely beyond the collector's control, but it is possible that they drive our data to represent densely-populated areas over sparsely-populated ones and schools over other institutions. Moreover, the choice to track physical manifestations of swastikas itself creates ambiguities. Unfortunately, the visual symbols of far-right, nationalistic, and identitarian hate groups spread well beyond the swastika, as the Southern Poverty Law Center has documented, and such symbolism spreads rapidly on-line, of course, not only in physical space.
With these ambiguities in mind, the interventions or "actionable insights" prompted by this map would largely be focused on schools and densely-populated, coastal areas. Yet, knowing that this is a growing and ambiguous sample—focusing on one symbol, on reported instances, and on physical space—we would have to take action knowing that it would be similarly limited. As in the food bank example, action taken from such data should be taken knowing that the data is not absolute but rather the result of situational constraints from the moment one declares data to be such to the moment one encounters a final representation and contextualization of that data.
The Watson texts provide us rich ground to question the ways in which we encounter, collect, contextualize, and present data to the public. Yet I propose that we encounter them knowingly, as the authors themselves do, mining the situational ambiguities that informed the final versions we see. Can we have a full representation of "truth" from Syria without the voices of women, and what social and material forces led to the suppression of those voices? Can we have a full representation of the truth of becoming a scientist without the investigation of how given documents were formed alongside teachers who either held to or pushed against local educational standards? Can we rely solely on reported instances of hate speech without the knowledge of the speaker or the testimony of the speaker? What are we to say of the (perhaps local or micro-level) political forces that inform such a rise? In short, if we are to take the data in these texts and others as "actionable," we can act on it only knowing that these ambiguities may force us to change course, to reckon with what one visualization or contextualization hides and another uncovers. Regardless of what role our encounters with such data call us to take on, the situational "becoming" of data and its resulting ambiguities teach us to remain open to other realities, presentations, contexts, and experiences, and adjust accordingly.
Works Cited
- Borgman, Christine L. Big Data, Little Data, No Data: Scholarship in the Networked World. MIT P, 2015.
- Drucker, Johanna. Graphesis: Visual Forms of Knowledge Production. Harvard UP, 2014.
- Gitelman, Lisa, ed. "Raw Data" is an Oxymoron. MIT P, 2013.
- Gries, Laurie. "Mapping Obama Hope: A Data Visualization Project for Visual Rhetorics." Kairos: A Journal of Rhetoric, Technology, and Pedagogy. vol. 21, no. 2, 2017. http://kairos.technorhetoric.net/21.2/topoi/gries/index.html
- Halpern, Orit. Beautiful Data: A History of Vision and Reason since 1945. Duke UP, 2014.
- Kimball, Miles A. and Charles Kostelnick, eds. Visible Numbers: Essays on the History of Statistical Graphics. Ashgate, 2016.
- Knaflic, Cole Nussbaumer. Storytelling with Data: A Data Visualization Guide for Business Professionals. Wiley & Sons, 2015.
- Kostelnick, Charles and Michael Hassett. Shaping Information: The Rhetoric of Visual Conventions. Southern Illinois UP, 2003.
- Mueller, Derek. "Grasping Rhetoric by Its Long Tail: What Graphs Can Tell Us about the Field's Changing Shape." College Composition and Communication, vol. 64, no. 1, 2012, pp. 195–223.
- Pearce, W. Barnett and Victoria Chen. "Ethnography as Semonic: The Rhetorics of Clifford Geertz and James Clifford." Rhetoric in the Human Sciences. Ed. Herbert W. Simons. SAGE Publications, 1989, pp. 119–32.
- Tufte, Edward R. The Visual Display of Quantitative Information. 2nd ed. Cheshire, Graphics P, 2015.
- Welhausen, Candice A. "Power and Authority in Disease Maps: Visualizing Medical Cartography Through Yellow Fever Mapping." Journal of Business and Technical Communication, vol. 29, no. 3, 2015, pp. 257-283.