Chapter 3: A Diachronic View of the Computers and Writing Conference
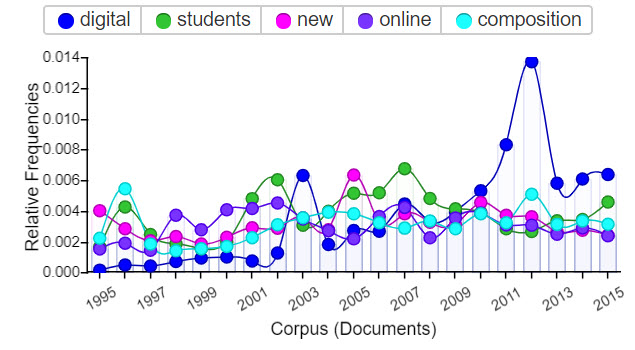
Figure 3.1. Relative frequencies of the top five keywords in Computers and Writing Conference programs, 1995–2015
Introduction
In this chapter we seek to answer the research question What do we learn about computers and writing by employing machine reading of twenty-one years (1995–2015) of conference programs from the (sub)field’s primary conference, Computers and Writing? In doing so, we employ a different research method, distant reading, than in the other chapters of this eBook to gain (and offer) a broader perspective on the (sub)field. The other chapters rely on information drawn from rhetorical and close textual analysis of selected representative texts in the (sub)field. Our method for selecting these texts is detailed in the Introduction. In brief, we selected five established areas of publication in the (sub)field: Computers and Composition, Computers and Composition Online, Kairos, programs from the Computers and Writing Conference, and frequently cited books. In order to narrow and focus twenty years of reading, we collected citation counts from Google Scholar for all articles and webtexts published during the years 1995–2015 in Computers and Composition and published during the years 1996–2015 for Kairos and C&C Online. These citation counts gave us a general indication of which key works and landmark texts to read closely.
However, it was still impossible for us to read all the texts that we could have from the past twenty years. In addition to the more traditional methods of historical storytelling and close readings of landmark texts, we also wanted to provide the kind of perspective that can be developed from a more systematic and digitized approach, particularly to take advantage of technologies unavailable when Hawisher et al. (1996) wrote The History Book. Thus, to give us a broader understanding of the (sub)field, we turned to a form of data collection and analysis called distant (or machine) reading.
Distant reading offers a method for gleaning information from large bodies of work and is popular in digital humanities (DH) approaches. The method of distant reading is attributed to literary theorist Franco Moretti (2007, 2013). Moretti and his method later came to represent the work of DH as it applies digital technologies for textual analysis. Distant reading generally refers to analysis of scholarly and literary texts (e.g., a corpus of published novels). However, decades before Moretti started studying vast corpora of literary works with his distant reading approach, linguists were employing the same kind of computerized, “big data” approach using concordance software to make claims about language use in context and over time. This empirical approach to the study of language is known as corpus linguistics.
The (sub)field of computers and writing has a history of publishing and citing work in corpus linguistics but has tended to limit use of that term to scholarship whose object of study is student work (e.g., a corpus of student papers). References to corpus linguistics were also more commonly seen in international scholarship (particularly scholarship from the United Kingdom). For example, in “Student Papers across the Curriculum: Designing and Developing a Corpus of British Student Writing,” Hilary Nesi, Gerard Sharpling, and Lisa Ganobcsik-Williams (2004) described their collaborative project “to compile a multimillion-word corpus of student writing” (p. 439). They pointed out, “Specialized corpora of only a few thousand words may be used to investigate features typical of specific genres or fields” (p. 440).
Their description applies to our approach in this chapter where we identify words and concepts that describe the general culture and scholarly trends of computers and writing. We analyze a corpus of 21 conference programs from the Computers and Writing Conference from 1995–2015 with a total of 27,098 unique word forms (including presentation titles and abstracts). We selected Computers and Writing Conference programs because Computers and Writing is the (sub)field’s flagship conference and its programs document the interests and work of its members. Given the association between corpus linguistics and studies of student writing, coupled with the association of the term distant reading with DH and its resultant greater familiarity to those in the (sub)field, we decided to use the latter term to describe our work for this chapter.
For this chapter, we used Voyant tools, a free, open-source, digital text analysis software tool, to conduct a distant reading of the conference programs from 1995–2015. We also turned to AntConc, another free, open-source digital text analysis software tool, to help fill in data we were unable to procure from Voyant.1 We then added to Voyant’s prepopulated stoplist our own list of words that we felt were either overly obvious and/or did not give us insight into the interests and trends of the (sub)field. Not surprisingly, computers and writing were the top two words before adding them to the stoplist. Our complete stoplist is available in Appendix A at the end of this chapter.
Within the larger field of writing studies and the more narrow (sub)field of computers and writing, scholars have adapted Moretti’s distant reading approach to various kinds of texts, including Conference on College Composition and Communication (CCCC) chairs’ addresses (Mueller, 2012); dissertations (Miller, 2014); College Composition and Communication, College English, Research in the Teaching of English, and other journal articles (Dryer, 2019); and English Journal articles (Palmeri and McCorkle, 2018). We were especially influenced by Palmeri and McCorkle’s (2018) work on English Journal, which was published in Kairos. They claimed, “If we remain too committed to teasing out every implication we can find in an individual text, we often lose sight of the broader systems and historical evolutions within which that text is embedded.” By taking a distant reading approach in this chapter, we hope to provide this broader, systemic vision of computers and writing. Because this chapter focuses on more data driven evidence and visualization, we do not include in it videos comprised of interview footage like are found in other chapters.
From our corpus of 21 Computers and Writing Conference programs, we used distant reading to investigate two research questions:
- Which terms are most commonly used in presentation titles, abstracts, and descriptions?
We contend that the top terms provide useful insight into how members of computers and writing characterize the (sub)field as well as the work they do and value. As shown in Table 3.1, digital, students, new, online, composition, and technology were the six terms that appeared most frequently. A difference of almost 400 mentions separated these terms from the next entry, media. Learning, research, and teaching rounded out the top ten. This top ten list evidences the sustained focus and interests of the (sub)field. That is, one could argue from this list that the defining focus of computers and writing is research on students’ use of new media, digital, and online technologies, including how best to use these technologies with students for teaching and learning.
Table 3.1 Top Ten Terms in Computers and Writing Conference Programs, 1995–2015
| Term | Count | |
|---|---|---|
| 1 | digital | 2090 |
| 2 | students | 1985 |
| 3 | new | 1547 |
| 4 | online | 1521 |
| 5 | composition | 1498 |
| 6 | technology | 1422 |
| 7 | media | 1081 |
| 8 | learning | 990 |
| 9 | research | 950 |
| 10 | teaching | 945 |
Figure 3.2 shows a word cloud visualization of the corpus’ top keywords. In his distant reading of CCCC Chairs’ addresses, Derek Mueller (2012) described word clouds as
providing a string of word formations sized and weighted with meaningful visual cues, somewhat like a lexical heat map. Indeed, like maps, clouds are more than neutral descriptions; they are constructs with properties that deliberately bring forward selected qualities of texts while downplaying others.
Like Mueller, we believe the word cloud provides an interesting distant view of the conference weighted by the interests and priorities of the (sub)field.
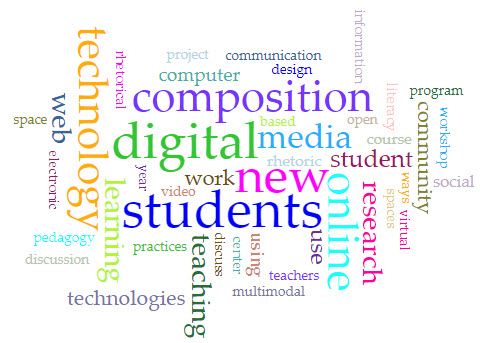
Figure 3.2. Word cloud visualization of top keywords in Computers and Writing Conference programs, 1995–2015, produced with Voyant
- What are trends in the (sub)field?
While we had hoped to discern trends and shifts in the (sub)field over time by attending to these top term results, “trending” terms were buried deep in the terms list, since they might be popular at certain times but not necessarily commonly used over time. Therefore, we realized we needed to develop our own list of trending keywords in the (sub)field that we could look at more closely. We developed our list based on reviewers’ recommendations and our own experiences of attending the conference (i.e., we searched for terms reviewers suggested as well as those that we noticed as particularly popular at various Computers and Writing Conferences). Additionally, we consulted scholarship in both writing studies as well as computers and writing, including Paul Heilker and Peter Vandenberg (2015), Claire Lauer (2009, 2014) and Courtney L. Werner (2015), that has generated, through various methods, lists of keywords and trending terms/concepts. Lastly, after we presented a selection of our work from this chapter at the 2019 Computers and Writing Conference Town Hall, we added some words suggested by audience members.
1:
Page 1
Keyword List
The hyperlinked list below provides the keywords that we searched. We grouped related terms together into categories (e.g., identity, writing instruction, pedagogy and theory, etc.), though we recognize these categories are somewhat arbitrary and others might align the terms differently. We list categories and terms alphabetically.
- Digital humanities (DH)
- Digital rhetoric
- Disciplines
- Visual rhetoric
- Game and Gaming
- Play
- Video game
- Cultural
- Disabilities
- Feminist
- Gender
- Identity
- Queer
- Race and Racial
- Methodology
- Qualitative and Quantitative
- Design
- Multimedia and Multimodal
- Sound and Visual
- Pedagogy and Theory
- Praxis
- Code and Coding
- Maker
- Process and Product
- First-year writing (FYW)
- Online writing instruction (OWI)
- Online writing lab (OWL)
- Spaces
In order to ensure that we did not overlook variations of a term that we simply were not thinking of, we used the wildcard Boolean operator * for terms with relevant variant forms.
For instance, we searched for both multimodal and multimodal*, racial, and raci*, and so forth. Included in this chapter are lists of the terms included in these wildcard searches. While this method of collecting data on keywords picked up some words that were not directly related to the way we were defining the term, this option seemed better than relying on our own generation of variants. Also, on occasion we were presented with an interesting usage of the term that we had not considered but then included in our discussion (e.g., coding). Upon a deeper dig into the data, we were often able to point out ways in which certain terms were being counted even when they were not directly related to what we were searching for (e.g., disabled). So while searching for a term with the wildcard (*) is imperfect in that it can pick up unintended term variants, just searching for the root term is also imperfect as it leaves out variant terms important and relevant to our understanding of the terms.
For each keyword we provide a line graph of relative frequencies of the form of the word most under discussion. This is usually the wildcard form (i.e., with *), even, in some cases, when the application of that wildcard was forced by Voyant (e.g., fyw); Voyant would not allow us to search for these certain terms without applying the wildcard. Readers can generate line graphs for terms not discussed in this chapter by visiting the Keywords page of this eBook and conducting their own searches of our corpus.
What follows are our findings for each of the keywords we searched. Our goal in this chapter is to curate these results for use by other teacher-scholars in the (sub)field. While we offer our own analysis of results when data suggested particular trends or relationships, the data we gathered did not necessarily suggest or support particular arguments. Thus, we look to readers of our eBook to use this data in their own future work on topics associated with these keywords.
In this chapter, we share our findings from targeted searches within the data for these keywords. For each term, we identify the following:
- Number of mentions
- Collocates
- Year(s) of highest relative frequency
- Examples of ways in which the word was used in conference programs
- When the term was introduced or when its use ceased, if relevant
- Overall trend(s), if any
Page 2
Word Usage over Time
We start our analysis by looking at keyword use over periods of time:
- All 21 years of our corpus (1995–2015)
- The last 10 years of our corpus (2006–2015)
- The last 5 years of our corpus (2011–2015)
In compiling these lists, we did not double count terms in these groups. For instance, while terms that appeared in all 21 years obviously also appeared in the last 10 and 5 years, we do not repeat them in those groups.
Just like terms with the highest number of mentions in the conference programs seem to resonate the (sub)field’s interests, words that appeared every year for all 21 years (1995–2015) of the programs in our corpus, which are shown below, also seem to suggest enduring interests and pursuits of the (sub)field.
Word Usage over Time: 1995–2015
- Culture
- Design
- Multimedia
- Pedagogy
- Sound
- Theory
- Visual
Words that appeared every year over the last ten years in our corpus (2006–2015) and the last five years in our corpus (2011–2015) suggest the (sub)field’s newer interests and pursuits.
Word Usage over Time: 2006–2015
- Code
- Digital rhetoric
- Disab*
- First-year writing
- Game
- Identity
- Methodology
- Multimodal
- Play
- Process
- Product
- Raci*
- Visual rhetoric
Word Usage over Time: 2011–2015
- Coding
- Digital humanities
- Praxis
- Video game
Broadly speaking, these results tentatively suggest the following trends:
-
Consistent among the (sub)field’s members have been attention to
- Both theory and pedagogy
- Cultural components of composing
- Multiple modes and media of communication
-
The last ten years of the period under review brought increased attention to
- Particular aspects of identity, including race and disability
- Applications of rhetoric to multiple modes and media, e.g., visual rhetoric, digital rhetoric
- The role of play and games in composing
-
The last five years of the period under review were characterized by increased attention to
- Digital humanities
- Computer programming/coding
- One particular kind of gameplay, video games
Page 3
Disciplinarity
Here we include those terms related to disciplines connected with or part of computers and writing: digital humanities, digital rhetoric, disciplin*, and visual rhetoric*.
Digital humanities
Digital humanities (DH) appeared for the first time in 2009 and then appeared in every program from 2011–2015, as shown in Figure 3.3. In 2009 it appeared in panels on undergrad DH projects, DH in relationship to writing centers, and DH in relation to academic collaborations. These panels included two presentations by Jentery Sayers, “Three Case Studies on the Emergence of Collaboration and Expertise in the Digital Humanities” and “Sustained Systems, Sustainable Research: A Look at Undergraduate, Project-Based Approaches to the Digital Humanities,” and one presentation by Nichole Poinski, “New Directions for the Non-Directive: The Digital Humanities and Writing Centers.” This was also the same year that the term first appeared in Computers and Composition (see our discussion in Chapter 4). Digital humanities’s relative frequency, 0.0007760, was significantly higher in 2012 (n = 17), when the conference theme was ArchiTEXTture, and 2014 (n = 21), when the theme was E/Re/Convolution. These were the only years its relative frequency was above 0.0006. In other years, its relative frequency never exceeded 0.0004.
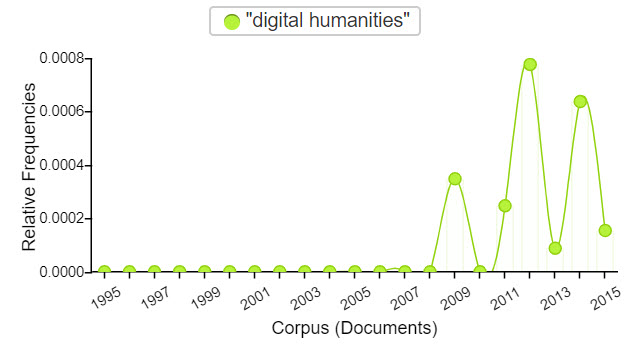
Figure 3.3. Relative frequencies of digital humanities in Computers and Writing Conference programs from 1995–2015
In 2011 and 2012 “digital humanities” was a standard tag presenters could select for their presentations in the program. Each of these years included a featured session on DH, specifically regarding its relationship with computers and writing. In the 2011 Town Hall “Are You a Digital Humanist?”, panelists “explore[d] how, if at all, the digital humanities intersects with the field of computers and writing” (p. 75). The 2012 featured session titled “Why Yes, We Are Digital Humanists!” responded in the affirmative, noting, however, that “while DH has garnered significant support in traditional liberal arts disciplines, including history and literary studies, the field of computers and writing has been slower to respond to this emerging field” (p. 45). We tackle this same question of computers and writing’s relationship with DH in Chapter 4.
Collocates included digital, social, composition, rhetoric, and scholarship. Presentations referenced DH in terms of making, such as the 2012 panel “Vibrant Materiality: Composing Matters with New Media,” which addressed “strategies for analyzing and producing new media compositions attuned to the dynamic forces of software and hardware” (p. 26) and the 2012 CREATE! workshop “Compose Yourself: Creating Digital Teaching Philosophies,” in which participants were “coached through the process of composing digital teaching philosophies” (p. 48). They also addressed DH in terms of theory, such as in Sayers’s 2009 presentation “Three Case Studies on the Emergence of Collaboration and Expertise in the Digital Humanities” and Kimberly Christen Withey’s 2014 keynote, “Centers and Margins: Access and the Ethics of Openness in the Digital Humanities.”
Digital rhetoric
Digital rhetoric appeared a total of 55 times in our corpus. It first appeared in 2003 in a presentation by Carolyn Handa titled “Multidisciplinarity, Multidimensionality, and Digital Rhetoric,” which focused on the idea that digital rhetoric should be “multidisciplinary” (p. 105). It appeared again in 2005 when it was the focus of two presentations, “Why We Should Recover Delivery for Digital Rhetoric” by James Porter and “Electronic Rhetoric in the Classroom: Hypertext, Argument, and the Student Writer” by Christine Alfano,” as well as two panels, one on “Contextualizing Digital Rhetoric” and the other on “Materializing Resistance: Digital Rhetoric as a Civic Technology.” After 2005 digital rhetoric appeared every subsequent year, peaking in 2014, with a relative frequency of 0.0005459 (n = 18), as shown in Figure 3.4.
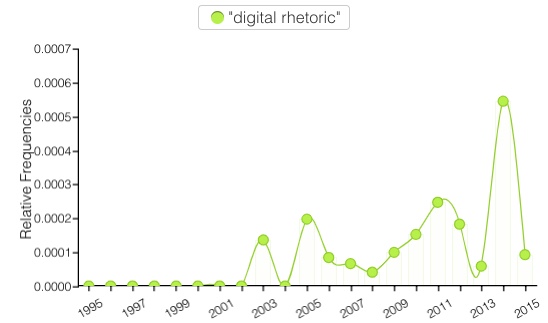
Figure 3.4. Relative frequencies of digital rhetoric in Computers and Writing Conference programs from 1995–2015
Disciplines
Disciplin* appeared a total of 200 times, with disciplines (n = 83) and disciplinary (n = 69) making up the bulk of that number. The terms included in the disciplin* wildcard search are listed below:
- disciplin* (200)
- disciplines (83)
- disciplinary (69)
- discipline (44)
- disciplinarity (2)
- disciplined (1)
- disciplineõs (1)
Collocates for disciplines included new, multi, meaning, teaching, learning, and instructors. Collocates for disciplinary included different terms, space, knowledge, identity, digital, students, and online. Disciplinarity appeared only twice.
Disciplin* appeared in every program after 1995, suggesting attention to disciplinary issues was a consistent focus of the (sub)field during the period under review. As shown in Figure 3.5, its highest relative frequency of 0.0007885 (n = 26) was in 2014, though its relative frequencies in 1998 (0.0006962, n = 3), 2000 (0.0006928, n = 7), and 2006 (0.0006736, n = 24) were close behind.
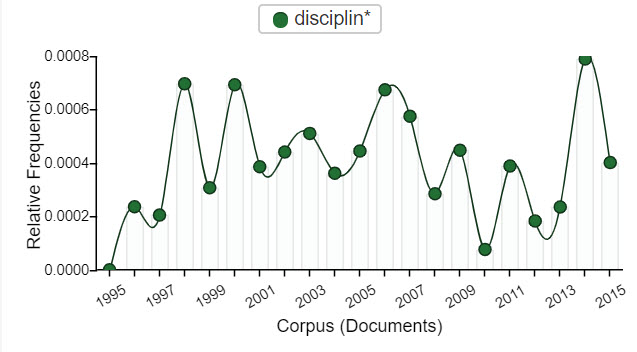
Figure 3.5. Relative frequencies of disciplin* in Computers and Writing Conference programs from 1995–2015
For the most part, disciplin* was used in session descriptions (e.g., to reference disciplinary values, writing in the disciplines, the subdiscipline of computers and writing) rather than in session titles. The only session title reference to disciplin* was Joanna Schmidt’s “Composing Learning Experiences: New Media, Classroom Flipping, and Interdisciplinary Influence” in 2014.
Visual rhetoric
Visual rhetoric appeared in every conference program between 2000–2015, though, as shown in Figure 3.6, its usage waned from 2012–2015. Its relative frequency did not exceed 0.0001 during that period. Visual rhetoric’s highest relative frequency, 0.0003532 (n = 10), was in 2011, when it was significantly higher than in any other year. Presentations on visual rhetoric that year included the panel “On the Critical Media: New Ways of Incorporating Video, Advertising and the Press in the Humanities Classroom,” which sought to “offer pedagogical strategies for incorporating YouTube, remix, mashup, digital storytelling, and other media forms in the classroom as a means for engaging students critically with the study and production of visual rhetoric” (p. 43), as well as the panel “#image: Social Tagging and Visual Rhetoric,” which examined “intersections of social tagging and visual rhetoric” (p. 49). Other presentations tagged with “visual rhetoric” include Kristin Arola’s “E-Racing the Interface,” David Bailey’s “Radical Remix: Genre Creation and Visual Rhetoric On the Open Web,” and Ryan Trauman’s “Functional Continuities Across Print and Digital Scholarly Books.” Visual rhetoric did not appear in conference programs from 1995–1998 and in 2000.
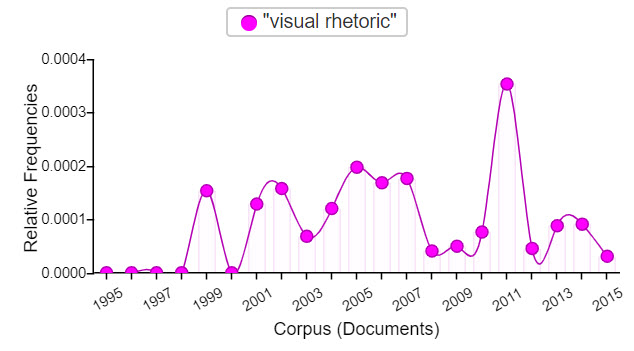
Figure 3.6. Relative frequencies of visual rhetoric in Computers and Writing Conference programs from 1995–2015
Page 4
Games
This page includes terms connected to games and play: game*, gami*, play, and video game.
Game and Gaming
Except for 1995, game was not used in conference programs in our corpus prior to 2003, as illustrated in Figure 3.7. Since then, it appeared in every conference program through 2015, signaling increased attention to games in the mid and late 2000s and early 2010s.
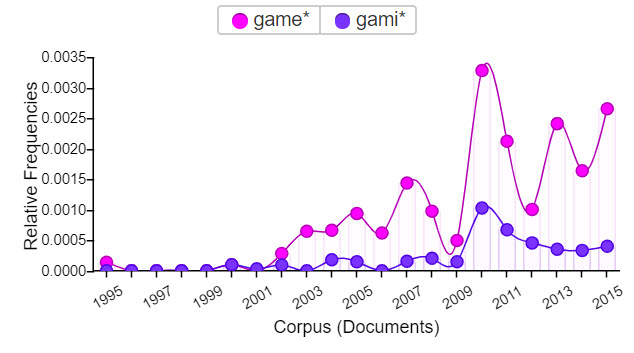
Figure 3.7. Relative frequencies of game* and gami* in Computers and Writing Conference programs from 1995–2015
Game appeared 255 times; games appeared almost as many at 251 times, giving these terms ranks of #105 and #108, respectively. Gamers, gamer, and gameplay round out the other references in the game wildcard (i.e., game*), as shown below in the list of terms included in the game* wildcard search and their total number of mentions:
- game* (571)
- game (255)
- games (251)
- gamers (23)
- gamer (8)
- gameplay (5)
- gamergate (5)
- gamesó (3)
- gameó (2)
- gameõs (2)
Gaming appeared 104 times in our corpus, peaking in 2010 with 26 mentions and a relative frequency of 0.0009907. This total number of mentions puts it at #382 and in the 98.6th percentile of words used.2 Gamification, the other major term represented by gami*, appeared 7 times. See below for a list of terms included in the gami* wildcard search:
- gami* (118)
- gaming (107)
- gamification (7)
- gamie (3)
- gamingõs (1)
Since 2010, when its use peaked, game’s relative frequency remained above 0.0005. Game’s relative frequency of 0.0017147 (n = 45) was, perhaps not surprisingly, highest that same year, 2010, when the conference theme was “Virtual Worlds.” At that conference “Sam and Dave’s Game-O-Rama” (named for hosts Samantha Blackmon and David Blakesley) was held; the conference held its own social networking game, Meetü; and featured speaker Hugh Burns gave the talk “Theorycrafting the Composition Game.” One of the program strands in 2010 was “Games and Gaming,” and numerous workshops, panels, and presentations, including “Second Life for Teachers and Writers,” “Multi-Authored Realities: Exploring Receptions and Depictions of Game Worlds,” and “The Game Outside the Game,” respectively, addressed intersections of computers and writing and games.
Play
Play appeared in every conference program in our corpus except 1998, with a total of 161 mentions, which gave it a rank of 211. Adding the wildcard (i.e., play*) brought the total to 339, including, as shown below, derivative terms like playing (n = 51) and players (n = 42):
- play* (339)
- play (161)
- playing (51)
- players (42)
- played (20)
- player (18)
- plays (17)
- playful (8)
- player's (3)
- playfully (3)
Play*'s relative frequency, as illustrated in Figure 3.8, was higher from 2007–2010 and from 2013–2015, with its highest relative frequency in 2008 at 0.0013830 (n = 34). In general, its use increased from 1995–2015, though not steadily. Its consistent use the last ten years suggests sustained attention to play in the latter years of our corpus. Its collocates (with game, role, and games as its top three) suggest play was most associated with game play.
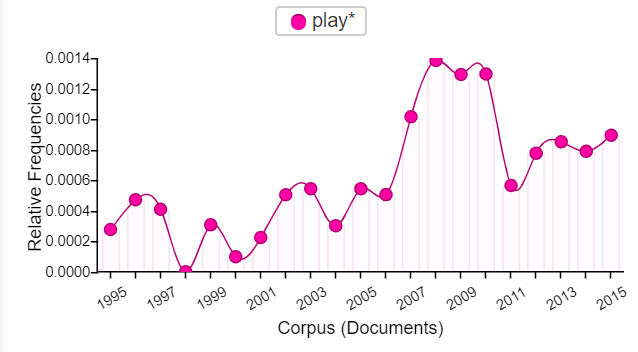
Figure 3.8. Relative frequencies of play* in Computers and Writing Conference programs from 1995–2015
Video game
Video game, like game, did not appear in conference programs in our corpus prior to 2003, as illustrated in Figure 3.9. Its use peaked in 2011, when its relative frequency was 0.0002826 (n = 8) and the conference theme was “Conference in Motion: Traversing Public/Private Spaces.” Its use fell steadily between 2011–2015, though it appeared every year from 2010–2015, suggesting sustained (if waning) interest during those years. It appeared a total of 40 times. Its association with lounge (its top collocate) suggests its use as a descriptor for a place at the conference for gamers to play.
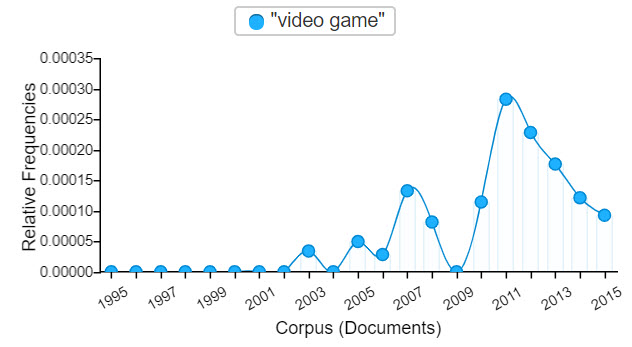
Figure 3.9. Relative frequencies of video game in Computers and Writing Conference programs from 1995–2015
2:
Page 5
Identity
This page comprises terms that reflect the (sub)field’s study of aspects of identity: cultur*, disab, femin*, gender, identit*, queer, race*, and raci*.
Cultural
Cultur* had a total of 566 mentions in our corpus. Cultural ranked #116 with 241 instances. Culture ranked just behind at #117 with 238 instances. Terms included in the cultur* wildcard search are listed below:
- cultur* (566)
- cultural (241)
- culture (238)
- cultures (63)
- culturally (13)
- cultureó (8)
- culture.ó (1)
- cultureñodissi (1)
- culturesó (1)
Its collocates included studies, rhetoric, popular (which had the highest statistical relevance of these collocates), political, and cross. Like most of the keywords, its frequency rose and fell, as shown in Figure 3.10, but it was one of the few terms that trended consistently across the two decades, with a relative frequency of 0.0015204 in 1995 (n = 11); a relative frequency of 0.0018642 in 2004 (the year it reached its highest relative frequency) (n = 32); and a relative frequency of 0.0010179 in 2015 (n = 33).
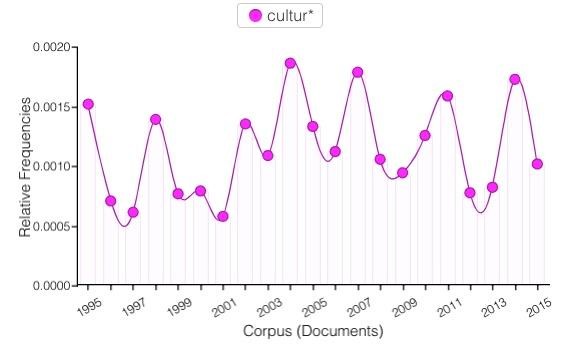
Figure 3.10. Relative frequencies of cultur* in Computers and Writing Conference programs from 1995–2015
Disabilities
Disabilities, disability, and disabled had a total of 64 mentions over the two decades in our corpus. The first references were in 1999, as shown in Figure 3.11.
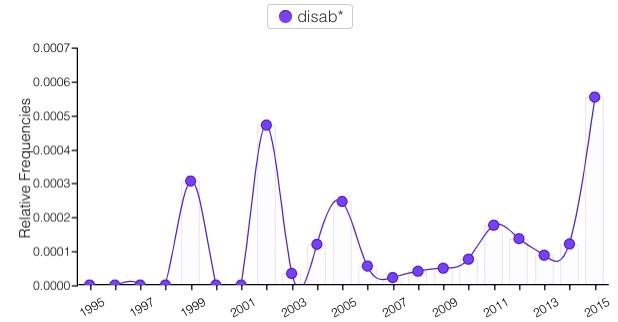
Figure 3.11. Relative frequencies of disab* in Computers and Writing Conference programs from 1995–2015
However, these two uses in 1999 referred to computer features being disabled rather than to human disabilities. It was not until 2002 that the term was used to refer to students with disabilities, in presentations like “Virtual Spaces and the Undergraduate Disabled Student: Access, Technology, and the Libratory Structures of Postmodernism” and featured speaker Norman Coombs’s presentation, “The Ramp To Accessible E-Learning: Including Students with Disabilities Online.” After 2002 disab* appeared in every conference program through 2015, and only in 2007 did the reference not apply to people with disabilities. In 2002 students with disabilities were the focus of Coombs's featured presentation; two other standalone presentations, “Virtual Spaces and the Undergraduate Disabled Student: Access, Technology, and the Libratory Structures of Postmodernism” and “Learning Online: The View from the Other Side of the Desk”; as well as a special open house, hosted by Brian W. Wojcik, showcasing the Special Education Assistive Technology (SEAT) Center at Illinois State University.
Terms included in the disab* wildcard search, along with their number of mentions, are listed below:
- disab* (65)
- disabilities (25)
- disability (24)
- disabled (15)
- disable (1)
Twelve years later, another featured speaker focused on disabilities. The 2014 conference featured Melanie Yergeau’s keynote, “Disable All the Things.” Moreover, Janine Butler won the Hawisher-Selfe Caring for the Future Award that year for her work on “deaf rhetorical practices,” (“Gail”), an illustration of the field’s heightened attention to disability studies. The year 2015 saw disab*'s highest relative frequency of 0.0005552 (n = 18) and included a panel themed around “Disabilities and Universal Access,” chaired by Liberty Kohn, as well as a roundtable, “Disability FTW! Activism, Embodiment, and Online Communities.”
Feminist
Femin* had 116 total mentions, and it appeared in every conference program in our corpus with the exception of 1995, 1997, and 2006. Feminist accounted for 88 of those mentions and feminism for 21. Feminist ranked #521, putting it in the 98th percentile of words in the corpus. Terms included in the femin* wildcard search are
- femin* (116)
- feminist (82)
- feminism (21)
- feminists (5)
- feminine (3)
- femininity (1)
- feminismñin (1)
- feminisms (1)
- feministth (1)
- feminization (1)
As shown in Figure 3.12, its highest relative frequency, 0.0009438 (n = 4), was in 1996, followed by its next highest relative frequency of 0.0009283 (n = 4) in 1998.
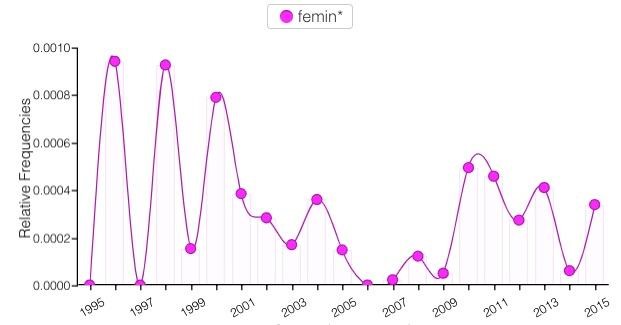
Figure 3.12. Relative frequencies of femin* in Computers and Writing Conference programs from 1995–2015
In 1996 feminist was used in reference to feminist research in Lisa Gerrard’s “Feminist Research in Computers and Composition” and to pedagogy in Beth E. Kolko’s “Sex and the Student Body: Feminist Pedagogy and Teachable Moments in the Electronic Classroom.”
The high relative frequency of femin* before 2001 is consistent with trends in higher education at that time. Women’s studies programs were first introduced in the 1990s, and interest in and debates around cultural studies, which included feminist theory and issues of identity within its critical approaches, was on the rise during that time period. Considering that computers and writing has identified as feminist since its origin, its relatively consistent use of keywords associated with feminism is not surprising. The fact that such keywords did not appear at all in three programs (1995, 1997, and 2006), however, is unexpected.
Gender
Gender* had 130 mentions over the two decades of our history. Its highest relative frequency, 0.0010225 (n = 5), was in 1997, as shown in Figure 3.13.
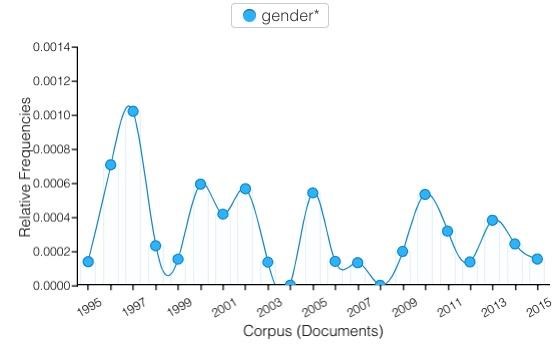
Figure 3.13. Relative frequency of gender* in Computers and Writing Conference programs from 1995–2015
Presentations on gender that year included Judy Chen’s “Gender Differences in Taiwan Business Writing Errors,” “Welcome to GE-L: A Return from the Margins Examining the Role of the Teacher in E-talk of Gender and Sexual Orientation,” and a Sunday session devoted to “gender issues” featuring presentations by Cynthia L. Selfe, Marilyn Cooper, Sibylle Gruber, Julia Ferganchick-Neufang, Annmarie Guzy, Anne F. Wysocki, and Gail E. Hawisher. This attention given to gender in the 1990s is in keeping with the attention finally given to gender as an area of study in higher education during the late 1980s and 1990s, when women’s and gender studies programs began to be established. The first annual Gender Caucus at Computers and Writing was established in 2013.
The terms included in the gender* wildcard search and their number of mentions are
- gender* (130)
- gender (105)
- gendered (18)
- genders (3)
- genderó (2)
- gender's (1)
- gendering (1)
Identity
The word identity, with 326 mentions, ranked #70 of all terms in the corpus, putting it in the 99.7th percentile of referenced words. This ranking suggests significant attention to issues of identity in conference presentations from 1995–2015, particularly within the past decade of the corpus, when it trended highest (with the exception of 2013).
In 2012, as shown in Figure 3.14, the relative frequency of identit* peaked at 0.0025564 (n = 74). This high relative frequency suggests 2012 was a big year for the exploration of self-representation and identity construction (including the construction of teacherly personas) in online spaces.
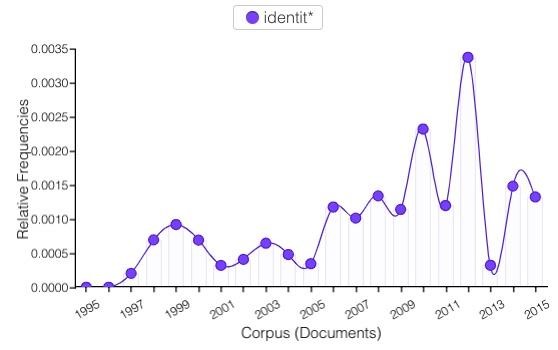
Figure 3.14. Relative frequencies of identit* in Computers and Writing Conference programs from 1995–2015
Collocates included online, social, digital, construction, and formation. Of these collocates, formation and construction had the highest statistical relevance to the word identity, which points to a consciousness about identity creation in digital and online spaces.
The terms included in the identit* wildcard search and their numbers of mentions are listed below:
- identit* (490)
- identity (326)
- identities (161)
- identityó (2)
- identitiesñalways (1)
Queer
Queer was mentioned 44 times in our corpus. Adding the wildcard (i.e., queer*) yielded 10 additional instances, including 3 mentions of queerness and 1 mention each of queered and queers. Below are the terms included in the queer* wildcard search along with the number of times they were mentioned:
- queer* (54)
- queer (44)
- queermoonity (3)
- queerness (3)
- queered (1)
- queerlyó (1)
- queermoonity's (1)
- queers (1)
As shown in Figure 3.15, queer* first appeared in 1999 and its relative frequency was highest in 2000 at 0.0007918 (n = 8). That year there was a strand in queer studies coordinated by Keith Dorwick, who also presented on the topic.
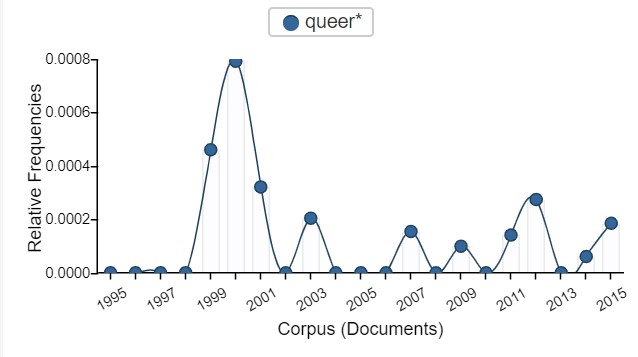
Figure 3.15. Relative frequencies of queer* in Computers and Writing Conference programs from 1995–2015
Race and Racial
As shown in Figure 3.16, race* did not appear in conference programs until 2001. Then it was frequently referenced alongside gender and class, which were two of its collocates. Other collocates included ethnicity, ableness, technology, and age. In 2013, twelve years after race*’s first introduction in Computers and Writing Conference programs, a Race Caucus was introduced at the conference (as mentioned earlier in this chapter, this same year a Gender Caucus was also started).
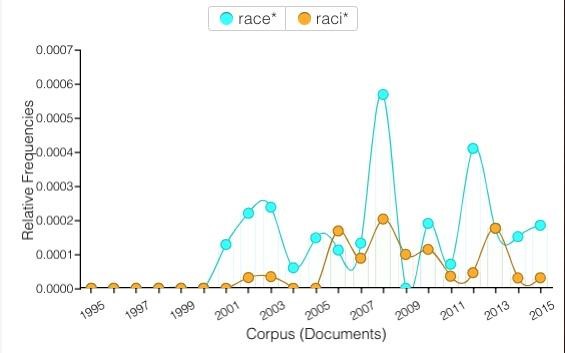
Figure 3.16. Relative frequencies of race* and raci* in Computers and Writing Conference programs from 1995–2015
Race, raced, and races together had a total of 78 mentions. Race ranked #597 with a total of 75 mentions. Terms included in the race* wildcard search and their number of mentions are
- race* (79)
- race (75)
- raced (2)
- races (1)
- racewell (1)
Raci* had a total of 32 mentions. Racial ranked #2,514.3 It first appeared in 2002 with only one mention, as Jacqueline Elaine Brown presented on the “digital/racial divide” from a psychological vantage point (pp. 115–116). Raci* peaked in 2008 with a relative frequency of 0.0002034 (n = 14). Terms included in the raci* wildcard search and how many times they appeared are listed below:
- raci* (32)
- racial (18)
- racialized (4)
- racially (3)
- racing (3)
- racism (3)
- racists (1)
In 2006 Samantha Blackmon presented “Night Elves, Negroes, and New Media Studies: Interrogating Racialized Representations in Video Games,” and her presentation accounted for five out of the six mentions of raci* that year. The one other mention of raci* was in a panel moderated by Will Hochman, “Converging Learning Literacies and Diverging Learning Spaces in FY Comp: Where Is the Class in This Class?” The abstract included a quote from Cynthia L. Selfe’s 1998 CCCC’s address, “Ideas, Historias y Cuentos: Breaking with Precedent,” which expressed concern over technological literacy and its relationship to racism and poverty.
In 2008 ideas about racial identity appeared in three panels/presentations: Rebecca Vanderslice’s presentation "Race and Children's Literature of the Gilded Age,” a panel titled “Racing Toward Digital Expression: Open Sourcing Ethnic Identity,” and Donnie Johnson Sackey’s “From the Public Sphere to the Public Screen: De/constructing Ethnic/racial Representation in SNS as Chronotope.”
Page 6
Methodology
Terms on this page relate to the (sub)field’s attention to methodology: methodolo*, qualita*, and quantit*.
Methodology
Methodolo* had 114 total mentions. It appeared once in 1995 (in Roni Keane’s “A Methodology for Analyzing Texts of Online Conferences”) and did not reappear in conference programs until 2001. See Figure 3.17.
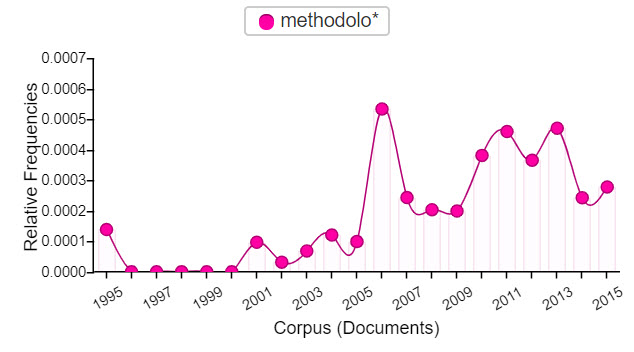
Figure 3.17. Relative frequencies of methodolo* in Computers and Writing Conference programs from 1995–2015
After this point it maintained a slow start with three or fewer mentions in the years 2001–2005. In 2006 its use peaked with 19 mentions. The conference theme that year was “Still on the Frontier(s),” and one of the questions its organizers posed was “How are we disseminating our research results?” While its frequency decreased after 2006, it continued to maintain a relative frequency at or above 0.0001988 (in comparison to at or below 0.0001203 between 2001–2006). Its collocates were research, digital, tags, theory, and new.
The terms from the methodolo* wildcard search and their number of mentions are
- methodolo* (114)
- methodology (51)
- methodologies (35)
- methodological (26)
- methodologically (1)
- methodologyó (1)
Qualitative and Quantitative
One dualism we looked at is the terms qualitative and quantitative. Neither term was used frequently, though of note is that qualitative (n = 46, qualita* n = 48) had over two times as many references as quantitative (n = 19, quantit n = 24). Qualitative ranked #1,069, while qualitative came in at #2,321. Below are the terms from the qualita* wildcard search and their totals:
- qualita* (48)
- qualitative (46)
- qualitatively (2)
Not surprisingly, qualitative and quantitative were the second collocates for each other. Other collocates for qualitative included research, study, studies, and data. Other collocates for quantitative were studies, research, intertextual, and hypertextual.
As shown in Figure 3.18, neither term was mentioned until 2001 and both trended similarly, with the exceptions of 2002 and 2009. In those years qualita* had a much higher relative frequency. The theme in 2002 was “Teaching and Learning in Virtual Spaces” (not surprisingly, pedagog* ranked much higher than theor* in this same year; see the Pedagogy and Theory section). And some sessions, like the half-day workshop “Evaluating Computer Mediated Classes,” discussed both qualitative and quantitative research methods. In 2009, the conference theme was “Ubiquitous and Sustainable Computing @ School @ Work @ Play.” The opening remarks in the 2009 program focused on the inclusion of “k–12 teachers as conference participants,” which might account for the increased focus on pedagogy and the qualitative that year.
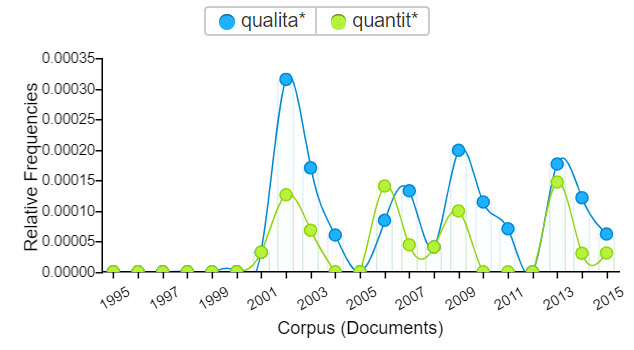
Figure 3.18. Relative frequencies of qualita* and quantit* in Computers and Writing Conference programs from 1995–2015
Page 7
Multimedia and Multimodal
This page contains terms that reflect the (sub)field’s focus on multimedia and multimodal texts: design, multimedia, multimodal, sound, and visual*.
Design
Along with multimedia, sound, and visual, design was used in every conference program from 1995–2015. This consistency signals design as a sustained interest for the (sub)field. Moreover, the consistency of this confluence of terms supports the (sub)field’s ongoing attention to multiple means and forms of writing. At 568 instances, design ranked as the 25th most mentioned term. Using the wildcard (i.e., design*) increased this total significantly to 882 as designed, designing, and designers were mentioned 125, 89, and 40 times, respectively. The terms included in the design* wildcard search and their numbers of mentions are
- design* (882)
- design (568)
- designed (125)
- designing (89)
- designers (40)
- designs (33)
- designer (13)
- designó (6)
- designated (3)
- designedly (1)
As shown in Figure 3.19, design*’s relative frequency was highest in 2012 at 0.0024194 (n = 53). That year, the conference was held at North Carolina State University, which has a renowned college of design, where several conference sessions were held. This accounts for a number of the mentions that year. In 2013, which had a nearly identical relative frequency at 0.0024091, almost all of the 82 mentions of design relate to the concept as we intend it. Design*’s relative frequency was lowest in 1999 at 0.0004606 (n = 3) when the conference theme was "Tradition and Technology." Design*’s relative frequency remained above 0.0013421 from 2000–2015 except for 2009.
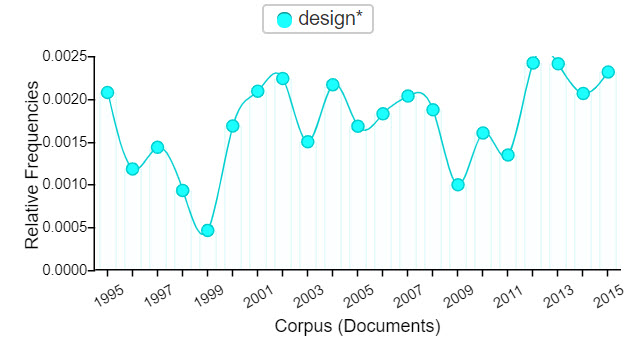
Figure 3.19. Relative frequencies of design* in Computers and Writing Conference programs from 1995–2015
In 2012 design was referenced in two Town Halls, “The Design of Learning Spaces: Perspectives from Across Fields and Disciplines” and “The Role of Design in New Media Composition,” and in a workshop on using InDesign, as well as in presentations on various kinds of design, including web design, course design, research study design, universal design, and classroom design. The conference theme that year was “ArchiTEXTure: Composing and Constructing in Digital Spaces,” and attention to details of design was built into the program’s opening welcome statement, which mentioned design and its variant forms four times.
Multimedia and Multimodal
Multimedia was used in every conference program from 1995–2015, suggesting multimedia was a sustained focus in the (sub)field. At 242 instances, however, it was not used as much as multimodal. Its rank of #115 was also well below that of multimodal (which ranked #40). As shown below, adding multimediated (n = 3) and multimediation (n = 2) increased the overall total only slightly:
- multimedia* (248)
- multimedia (242)
- multimediated (3)
- multimediation (2)
- multimediathe (1)
Multimedia’s relative frequency was highest in 1997 (0.0012270, n = 5) and lowest in 2000 (0.0001979, n = 2). In the 1997 conference in Hawai’i, the term appeared in presentations such as “Building Multimedia Documents” by David E. Hailey, Jr., “Reshaping the Research Paper Using a Multimedia Approach” by Laurel Browning, “Designing and Constructing a Multimedia Authoring Classroom” by Tharon Howard, and “A History of Some Writing in Color and Time: Reporting from Both Sides of a Multimedia Class” by Marilyn Vogler Urion and Anne Wysocki, as well as another presentation by Wysocki titled “Calling Out Gender in Multimedia: Learning from Fatty Bear.” In general, use of multimedia decreased since 2005, though not steadily as its use increased from 2009–2011.
As compared to multimodal, multimedia was the more popular term until 2008. As shown in Figure 3.20, multimodal* was then the more popular term from 2008–2015, though their relative frequencies were nearly identical from 2006–2010. Multimodal*’s usage was significantly higher starting in 2011, signalling a shift in the (sub)field's language.
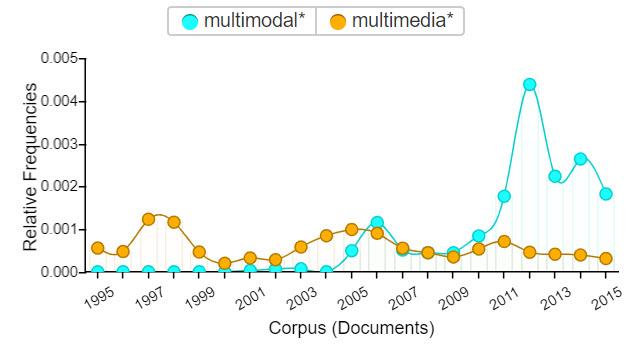
Figure 3.20. Relative frequencies of multimodal* and multimedia* in Computers and Writing Conference programs from 1995–2015
Multimodal was mentioned 429 times in conference programs, making it the 40th most used term in the corpus. As shown below, multimodality occurred 50 times and multimodalities occurred just 3 times:
- multimodal* (489)
- multimodal (429)
- multimodality (50)
- multimodalities (3)
- multimodalarchival (1)
- multimodalitiesó (1)
- multimodalliteracies (1)
- multimodallmultimedia (1)
- multimodalInvention
- multimodally (1)
Multimodal first appeared in conference programs in 2001 with Emmanuel Savolpoulus’s presentation “Suggestions for a Hypermedia Literacy that is Multimodal,” in which he gestured to how approaching literacy “through the lens of information technologies” attends to, among other aspects, issues of “embodiment and representation” (p. 84). Use of the term multimodal increased from 2011–2015. As shown in Figure 3.20, its relative frequency remained above 0.001 for this period; previously it did not exceed this level.
Multimodal’s relative frequency was highest in in 2012 when it was 0.004382 (n = 91). That year the conference theme was “ArchiTEXTure: Composing and Constructing in Digital Spaces.” References to this keyword in the 2012 program include the half-day workshop “The Sights and Sounds of ArchiTEXTure: Modeling Multimodal Composition” and the presentation “Multimodality and Identities in Digital Terrains.”
Multimodal was used largely as a descriptor of writing activity (e.g., in the phrases “multimodal composing” and “multimodal writing”), texts produced (e.g., in the phrase “multimodal texts”), and assignments (e.g., in the phrase “multimodal assignments”). That tags was one of multimodal’s collocates suggests that it was frequently used as a tag in the 2012 program, which printed tags associated with each presentation. This feature of the 2012 program is likely also why 2012 had the highest relative frequency for multimodal (and perhaps for other terms as well).
Sound and Visual
Sound appeared in every conference program from 2000–2015, though its relative frequency was quite low from 2001–2004 and again in 2008 and 2010. As shown in Figure 3.21, sound*’s relative frequency was highest at 0.0011869 (n = 26) in 2012, when it appeared in the half-day workshop “The Sights and Sounds of ArchiTEXTure: Modeling Multimodal Composition” and the panel descriptions for “Ways of (Sonic) Being: Composing and Performing Sonic Rhetorics”; “Multimodal Place: Soundwriting, Transcripts, and Transmedia”; and “The ‘New’ Future of Auditory Rhetoric(s): Sound and Silence ‘Scene’ through Productive Difference.”
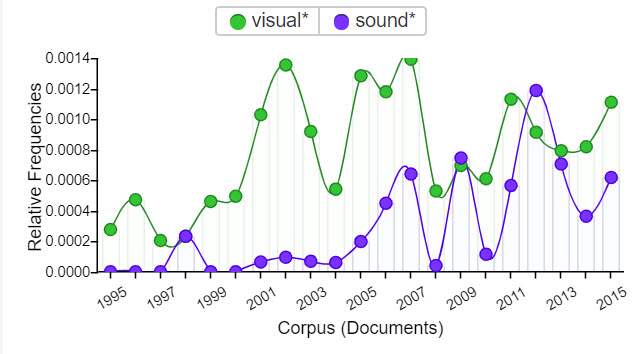
Figure 3.21. Relative frequencies of visual* and sound* in Computers and Writing Conference programs from 1995–2015
The terms included in the sound* wildcard search and their numbers of mentions are
- sound (175)
- sound (136)
- sounds (18)
- soundcloud (4)
- sounding (2)
- soundõs (2)
- soundtrack (2)
- soundwriting (2)
- soundcloudõs (1)
- sounded (1)
At 136 instances, sound ranked #276 among terms in the corpus. Sound was used few times prior to 2005, though it did have a small spike in use in 1998 when it was referenced in the presentation “Sounding the MOO'd: Audio and Voice in Text-based Virtual Environments” by Jane Love. It did not appear in conference programs in our corpus before 1998. As shown in Figure 3.21, in general its use increased from 1995–2015 but not steadily or consistently.
There were 363 instances of visual in the conference programs, which gave it a rank of #58, placing it in the 99.8th percentile of words in the corpus. Adding the wildcard (visual*) brought the total instances to 441, as shown below. Visually appeared 19 times, while visualization and visualizing each appeared 13 times:
- visual* (441)
- visual (363)
- visually (19)
- visualization (13)
- visualizing (13)
- visuals (11)
- visualizations (8)
- visualize (7)
- visualized (3)
- visualó (2)
Visual was mentioned in every conference program from 1995–2015, suggesting attention to the visual was an ongoing focus of the (sub)field. This consistent presence affirms that computers and writing was interested in—as well as an important disciplinary contributor to—the visual turn. Indeed, Judith Szerdahelyi’s 2007 presentation explicitly invoked “The Visual Turn in Virtual Pedagogics” (p. 33).
As shown in Figure 3.21, visual*’s relative frequency was highest at 0.0013911 (n = 63) in 2007, when the conference theme was "Virtual Urbanism," and lowest at 0.0002045 (n = 1) in 1997, a conference for which there was no explicit theme. Its relative frequency remained above 0.0005 since 2000. That rhetoric had the most statistical relevance suggests visual was most used as a descriptor of rhetoric (i.e., in the phrase “visual rhetoric”), as illustrated by Jill Mckay Chrobak’s 2007 presentation “Fumbling Towards Technology: A Tech-Hater Teaches the Visual Rhetoric of Hip Hop” and Angela Crow’s two 2002 presentations, “Visual Rhetoric, Cognitive Development, and First-Year Writing” and “Visual Rhetorics and Studies Tracking Eye Movements in Older Adults.”
As shown in Figure 3.21, in general references to visual* outpaced references to sound*, except in 1998, 2009, and 2012, when their relative frequencies were close.
Page 8
Pedagogy and Theory
This page includes terms related to one of the underlying tensions of the (sub)field, pedagogy and theory: pedagog*, theor*, and praxis*.
Pedagogy and Theory
In most years, references to pedagogy outpaced references to theory in conference programs from 1995–2015. Pedagog* had a count of 1047, whereas theor* showed up a little over half that amount at 652. The term pedagogy ranked #29 (n = 531), putting it in the 99.9th percentile of words referenced. Pedagogical ranked #60 (n = 356) and theory ranked #79 (n = 301). Terms included in the pedagog* wildcard search and their numbers of mentions are
- pedagog* (1047)
- pedagogy (531)
- pedagogical (356)
- pedagogies (128)
- pedagogically (18)
- pedagogyó (7)
- pedagogic (2)
- pedagogiesó (2)
- pedagogics (1)
- pedagogues (1)
Terms included in the theor* wildcard search and their numbers of mentions are
- theor* (652)
- theory (301)
- theories (124)
- theoretical (122)
- theorizing (30)
- theorize (28)
- theoretically (12)
- theorists (9)
- theorized (8)
- theorist (4)
As shown in Figure 3.22, pedagog* had a higher relative frequency every year except 2000 and 2004, when the conference themes were “Evolution, Revolution, and Implementation: Computers and Writing for Global Change” and “Writing in Globalization: Currents, Waves, Tides,” respectively. It is interesting to consider to what, if any, extent the global themes of these years contributed to theor*’s higher relative frequency (i.e., to more attention to theory over pedagogy).
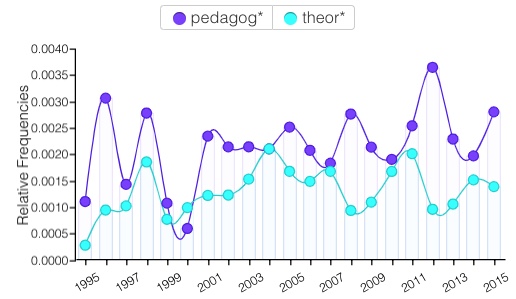
Figure 3.22. Relative frequencies of pedagog* and theor* in Computers and Writing Conference programs from 1995–2015
While pedagogy ranked in the top six collocates for theory, theory did not rank in the top six for pedagogy. Collocates for pedagogy included technology, digital, rhetoric, composition, tags, and journal. Collocates for theory included practice, digital, media, practical, and rhetorical.
Praxis
Praxis, a term blending pedagogy and theory, was referenced far less frequently than those terms. With only 31 mentions across our corpus, it ranked #1,5634, though, as indicated earlier in this chapter, it appeared every year from 2011–2015. As shown in Figure 3.23, it was used most frequently in the years 1998, 2000, and 2001 (in descending order). In 2001 one of the conference’s strands was K–16 Praxis, which included four sessions, so this likely accounts for the higher relative frequency that year. Collocates for praxis included theory, technologies, rhetoric, digital, bootstrapping, wampum, messiness, workable, and performs.
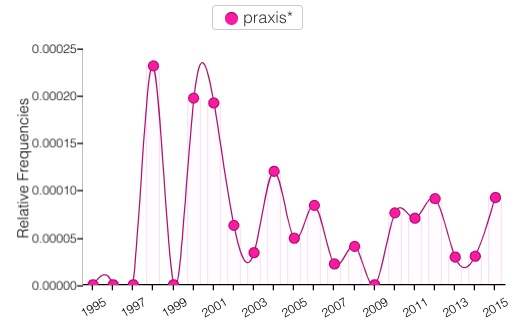
Figure 3.23. Relative frequencies of praxis in Computers and Writing Conference programs from 1995–2015
Page 9
Process and Product
Terms on this page reflect another underlying tension of the (sub)field, process and product: code, coding, maker, process, and product*.
Code and Coding
Code had a total of 82 mentions in our corpus (84 with the word coders). Coding added 28. Coding and code were both first mentioned in 1998, as shown in Figure 3.24. Coding was used to describe “coding the ‘gateway’ course” in a session on “History and Institutional Goals of a ‘Gateway’ Course.” And code was used in a presentation titled “Wired Life: Remedial Source Code for the New Home Page.” In 2002, code was featured in four different workshops/sessions. It appeared every year thereafter, generally trending upward in frequency, with the exception of 2004. Coding followed suit but was not mentioned in 2004, 2005, and 2007.
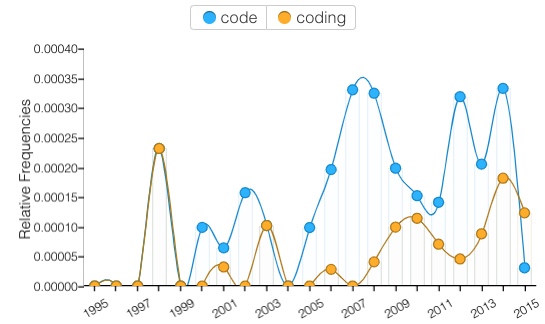
Figure 3.24. Relative frequencies of code and coding in Computers and Writing Conference programs from 1995–2015
The collocates for each term differed. Collocates for code included digital, open, studies, and rhetorical. Collocates for coding included wysiwyg, timelines, scheme, triangulating, and crisis. The last came from a 2015 paper on “Broken to Be Made: The Rhetoric and Reality of the Coding Crisis” by Benjamin Smith. Given its collocates, the use of coding seems to be associated more with research activity (i.e., coding data) than computer programming. Examples that illustrate this usage include Christopher Dickman’s 2014 presentation “From Collection to Coding: Interrogating Researching Methods for Online Reader Comments” and Jennifer Bowie and Heather McGovern's 2010 presentation on empirical research from four journals in computers and writing from 2003–2008 (in which they discussed the coding scheme they applied).
Maker
Maker* was used only 15 times over the two decades of our corpus. Terms included in the maker* wildcard search, including maker, makers, and makerspaces, and their totals are shown below:
- maker* (15)
- maker (11)
- makers (2)
- makerspaces (2)
As shown in Figure 3.25, maker*’s relative frequency was never above 0.00015. It did not appear in numerous conference programs, including 1996–2001, 2003, 2004, 2006, 2008, and 2010–2012.
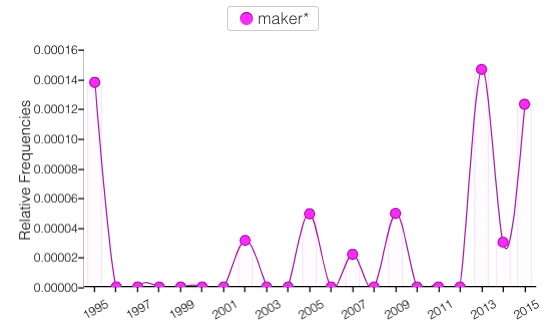
Figure 3.25. Relative frequencies of maker* in Computers and Writing Conference programs from 1995–2015
The maker movement was not referenced in conference programs until James Paul Gee’s 2013 keynote, “Writing in the Age of the Maker Movement,” at the Frostburg State University conference. Likely given this association with the maker movement, maker*’s relative frequency was highest in that year at 0.0001469 (n = 5). The terms maker and make, however, appeared as early as 1995, giving some visible support to Cheryl E. Ball’s claim that members of the (sub)field have always been (interested in) making things (this claim is discussed in more detail in Chapter 4). As illustrated by Annie Olson’s 2002 presentation, “Situating Invention: Taking Bakhtin into the MOO,” computers and writing practitioners have long been “writer[s]/meaning-maker[s]” (p. 59). They have also been makers of media, as illustrated by Susan Romano’s 1995 presentation, “Reader, Writer, Interface-Maker,” and Mary Minock’s 2007 presentation on MovieMaker, “Bringing It All Back Home: Teaching Poetry with New Media.” But it was only from 2013–2015 that references to maker* were explicitly related to maker culture or the maker movement.
Process and Product
Given the explicit process orientation of the (sub)field, we searched for instances of process and its “opposite” product in conference programs in our corpus. As might be expected, process was used more frequently than product. Process ranked #68, while product ranked #961. Production—a version of product that has echoes of process—ranked #158. As shown in Figure 3.26, process appeared in every conference program except for 1995 and 1999, an absence that is perhaps surprising given the explicit feminist origins of the (sub)field (which we discuss in the Introduction). It was mentioned 330 times, and its relative frequency was highest in 2008 at 0.0013017 (n = 32). Discussions of process also included the term post-process in years 2006, 2008, and 2010, the only years in which that term appeared across the two decades.
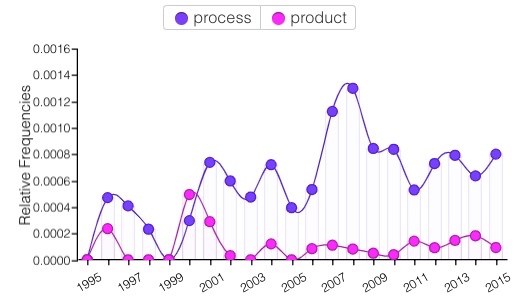
Figure 3.26. Relative frequencies of process and product in Computers and Writing Conference programs from 1995–2015
Product was mentioned 50 times, while product* appeared 378 times. Terms included in the product* wildcard search and their total numbers of mentions are
- product* (378)
- production (205)
- productive (51)
- product (50)
- products (35)
- productively (13)
- productions (12)
- productivity (10)
- productionñas (1)
- productionó (1)
Product was used most in 1996 and 2000, as shown in Figure 3.26. These were the only years its relative frequency was above 0.0002. Product’s relative frequency was highest in 2000 at 0.0004949 (n = 5), when its relative frequency was more than double that of most other years, primarily due to a “Technology Product Design Competition” sponsored by McGraw-Hill. The term did not appear in programs in 1995, 1997–1999, 2003, and 2005.
Product and process were collocates. With more frequent use of process in conference programs, it seems safe to conclude that product was generally discussed in the context of process, which is consistent with the (sub)field’s overall focus on process. Other collocates for product included competition, design, and saturation. Other collocates for process included collaboration, revision, recursive, students, peer, review, and composing.
Page 10
Writing Instruction
Included here are terms related to writing instruction: first-year writing, FYW, online writing instruction, OWI, online writing lab, OWL, and space*.
First-year writing (FYW)
FYW (the acronym) appeared only 5 times in the two decades of our corpus, in 2008 and 2015. Its collocates included composition, classes, courses, incorporate, and multimodal. First-year writing (no acronym)5 had 114 mentions and began appearing in conference programs in 2000, with mentions every year thereafter. As shown in Figure 3.27, its highest relative frequency of 0.0011859 (n = 26) was in 2012. Notably, that year’s conference at North Carolina State University was sponsored “through a combined effort of the First-Year Writing and the Communication, Rhetoric, and Digital Media programs” (p. 1), which might account for the higher relative frequency that year.
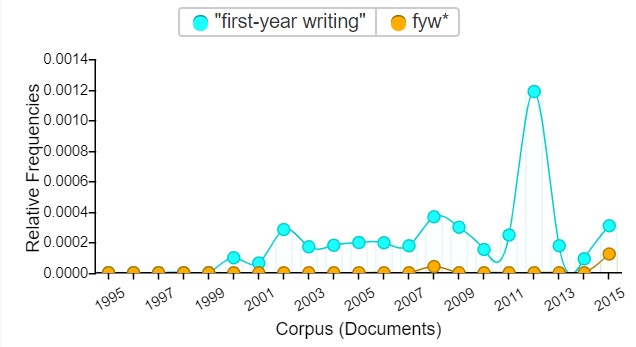
Figure 3.27. Relative frequencies of first-year writing and fyw* in Computers and Writing Conference programs from 1995–2015
Online writing instruction (OWI)
As shown in Figure 3.28, the first mention of OWI (the acronym) in conference programs was in 2014, in a presentation discussing it alongside OWLs: “Placing the Asynchronous Writing Dialogue: Evolving ‘Writing Place’ Theory to Locate OWL and OWI Interfaces.” Overall, though, OWI occurred infrequently, appearing only a total of 8 times between 2014–2015. Its collocates included asynchronous, OWL, baseline, creating, requirements, and customized.
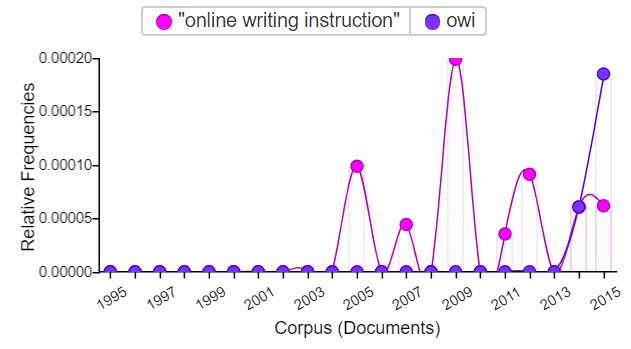
Figure 3.28. Relative frequencies of online writing instruction and owi in Computers and Writing Conference programs from 1995–2015
Online writing instruction (no acronym) appeared nearly ten years earlier than OWI, in 2005, in a panel called “Preparing Educators for Online Writing Instruction” and had a total of 15 mentions. Its use peaked at the 2009 conference, during which The CCCC Committee on Best Practices for Online Writing Instruction gave a workshop, “Best Practices for Online Writing Instruction.”
Online writing lab (OWL)
OWL (the acronym) had 64 mentions in our corpus. As shown in Figure 3.29, its use peaked in 2003 with a relative frequency of 0.0005104 (n = 15), followed closely by 2002 with 0.0004725 (n = 15) and 2001 with 0.0004499 (n = 14). With the exception of those years, its frequency remained low (averaging 3 mentions per year) but steady across the two decades, with 2 references in 1995 and 3 in 2015. Online writing lab (no acronym) had only 11 mentions over the two decades, with its highest relative frequency of 0.0001382 (n = 1) at the beginning of the period of our history in 1995.
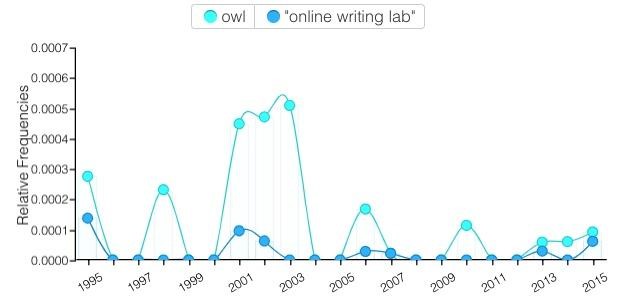
Figure 3.29. Relative frequencies of owl and online writing lab in Computers and Writing Conference programs from 1995–2015
Spaces
Space had a total of 1,056 mentions and appeared in every one of the 21 programs of our corpus. Below are terms included in the space wildcard search (i.e., space*) and their totals. Spaces had the highest number of mentions at 605.
- space* (1056)
- spaces (605)
- space (438)
- spacesó (3)
- spaceã (1)
- spaceñdepending (1)
- spaceóñwhere (1)
- spacesñbecause (1)
- spacesñbreakout (1)
As shown in Figure 3.30, space*’s use peaked, with a relative frequency of 0.0060257 (n = 132), in 2012, which, not surprisingly, was the year the theme was “ArchiTEXTure,” and multiple presentations and panels connected to this theme with presentations on virtual and physical spaces. Its second highest year was 2007, with a relative frequency of 0.0046810 (n = 212). In that year many of the presentations were about the various platforms regarded as spaces for creating or composing: instant messaging, wikis, blogs, video games, online/computer mediated communication (CMC), and course/content management systems. While the majority of these presentations made use of space in the context of discussing online and virtual writing spaces, at least five presentations discussed urban spaces (some of these were also described as virtual), given the conference theme of “Virtual Urbanism.” Collocates included digital, new, students, virtual, urban, writing, and online.
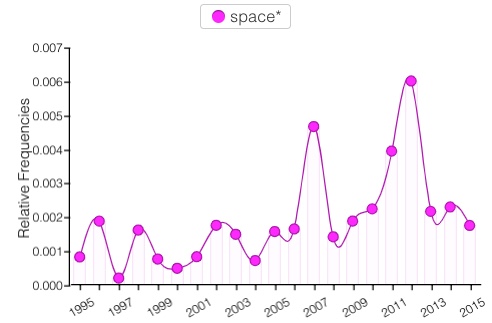
Figure 3.30. Relative frequencies of space* in Computers and Writing Conference programs from 1995–2015
5:
Page 11
Conclusion
Machine reading of programs provides only a partial picture of the Computers and Writing Conference, and Computers and Writing Conference programs themselves provide only a partial picture of the (sub)field. Still, we contend machine reading this corpus allows us to chart sustaining and new areas of inquiry that help us and others understand the (sub)field's place within the academy and our places as individual teacher-scholars within the (sub)field.
Analysis reveals that throughout the period under review (1995–2015) the (sub)field focused on both pedagogy and theory, cultural aspects of composing, as well as multimedia and multimodal composing. Space and design were also sustained interests. The latter half of the period under review (2006–2015) brought increased attention to race and disability, visual and digital rhetoric, and play and games. Newer focal areas (2011–2015) included the digital humanities, video games, and code.
Page 12
Appendix A: Voyant Stoplist
Below are the terms, numbers, letters, and symbols that were filtered out of Voyant searches.
- !
- $
- %
- &
- -
- .
- 0
- 00
- 1
- 10
- 100
- 11
- 12
- 13
- 14
- 15
- 16
- 17
- 18
- 19
- 1990
- 1991
- 1992
- 1993
- 1994
- 1995
- 1996
- 1997
- 1998
- 1999
- 2
- 20
- 2000
- 2001
- 2002
- 2003
- 2004
- 2005
- 2006
- 2007
- 2008
- 2009
- 2010
- 2011
- 2012
- 2013
- 2014
- 2015
- 2016
- 2017
- 2018
- 2019
- 2020
- 21
- 22
- 23
- 24
- 25
- 26
- 27
- 28
- 29
- 3
- 30
- 31
- 32
- 33
- 34
- 35
- 36
- 37
- 38
- 39
- 4
- 40
- 41
- 42
- 43
- 44
- 45
- 46
- 47
- 48
- 49
- 5
- 50
- 51
- 52
- 53
- 54
- 55
- 56
- 57
- 58
- 59
- 6
- 60
- 61
- 62
- 63
- 64
- 65
- 66
- 67
- 68
- 69
- 7
- 70
- 71
- 72
- 73
- 74
- 75
- 76
- 77
- 78
- 8
- 80
- 81
- 82
- 83
- 84
- 85
- 86
- 87
- 88
- 89
- 9
- 90
- 91
- 92
- 93
- 94
- 95
- 96
- 97
- 98
- 99
- :
- ;
- <
- >
- @
- (
- )
- *
- ?
- [
- ]
- ^
- {
- }
- a
- a.m
- a.m.
- about
- above
- across
- after
- afterwards
- again
- against
- all
- almost
- alone
- along
- already
- also
- although
- always
- am
- among
- amongst
- amoungst
- amount
- amp
- an
- and
- another
- any
- anyhow
- anyone
- anything
- anyway
- anywhere
- are
- around
- as
- at
- b
- back
- be
- because
- been
- before
- beforehand
- being
- beside
- besides
- between
- both
- bottom
- bowling
- building
- but
- by
- c
- california
- call
- can
- cannot
- cant
- carolina
- chair
- classroom
- co
- college
- computers
- con
- conference
- could
- couldnt
- d
- day
- de
- did
- didn't
- div
- do
- does
- doesn't
- don't
- done
- down
- due
- during
- e
- each
- edu
- eg
- eight
- either
- eleven
- else
- elsewhere
- enough
- etc
- even
- ever
- every
- everyone
- everything
- everywhere
- except
- f
- few
- fifteen
- fify
- fill
- find
- fire
- first
- five
- florida
- for
- former
- formerly
- forty
- found
- four
- friday
- from
- front
- full
- further
- g
- georgia
- get
- give
- go
- h
- had
- hall
- has
- hasnt
- have
- he
- hence
- her
- here
- hereafter
- hereby
- herein
- hereupon
- hers
- herself
- him
- himself
- his
- how
- however
- hundred
- i
- ie
- if
- illinois
- in
- inc
- indeed
- ing
- into
- is
- it
- its
- itself
- j
- john
- june
- k
- keep
- l
- last
- latter
- latterly
- least
- less
- ltd
- m
- made
- many
- may
- me
- meanwhile
- michael
- michigan
- might
- mill
- mine
- moderator
- more
- moreover
- most
- mostly
- move
- much
- must
- my
- myself
- n
- name
- namely
- neither
- never
- nevertheless
- next
- nine
- no
- nobody
- none
- noone
- nor
- not
- nothing
- now
- nowhere
- nq
- o
- of
- off
- often
- on
- once
- one
- only
- onto
- or
- other
- others
- otherwise
- our
- ours
- ourselves
- out
- over
- own
- p
- p.m
- p.m.
- page
- panel
- part
- per
- perhaps
- please
- pm
- presentation
- presentations
- purdue
- put
- q
- r
- rather
- re
- room
- s
- same
- saturday
- see
- seem
- seemed
- seeming
- seems
- serious
- session
- several
- she
- should
- since
- six
- sixty
- so
- some
- somehow
- someone
- something
- sometime
- sometimes
- somewhere
- st
- state
- still
- such
- sunday
- system
- t
- take
- ten
- texas
- than
- that
- the
- thee
- their
- them
- themselves
- then
- thence
- there
- thereafter
- thereby
- therefore
- therein
- thereupon
- these
- they
- thing
- third
- this
- those
- thou
- though
- three
- through
- throughout
- thru
- thursday
- thus
- thy
- to
- together
- too
- toward
- towards
- town
- twelve
- twenty
- two
- u
- un
- under
- university
- until
- up
- upon
- us
- v
- very
- via
- w
- was
- we
- wednesday
- well
- were
- what
- whatever
- when
- whence
- whenever
- where
- whereafter
- whereas
- whereby
- wherein
- whereupon
- wherever
- whether
- which
- while
- whither
- who
- whoever
- whole
- whom
- whose
- why
- will
- with
- within
- without
- would
- writing
- x
- xd
- y
- yet
- you
- your
- yours
- yourself
- yourselves
- z
- |
- ð
- br
Page 13