Acting with Tables for the Engineering Lab Activity
Alexandra’s history of acting with tables would include the first lab activity that Alexandra and her teammates completed early in the semester, some seven weeks before the major project was assigned. The goal of the lab activity was to design an airplane that consistently flew far and could also be folded by anyone through conducting a series of performance trials testing the effects of four parameters (the location of a paper clip weight, the planes’ stabilizer settings, the nose length, and the wing angle) on flight performance. The lab activity provided students an opportunity to work with some of the same kinds of inscriptions and perform some of the same calculations they would later use for the higher-stakes major design project.
In the brief video clip (below) from one of our interviews, Alexandra discusses the cascade of tables that animated the collection and interpretation of data during the lab activity.
Figure 3
Alexandra's Flying Plane Distance Record Table
(Click to Enlarge)
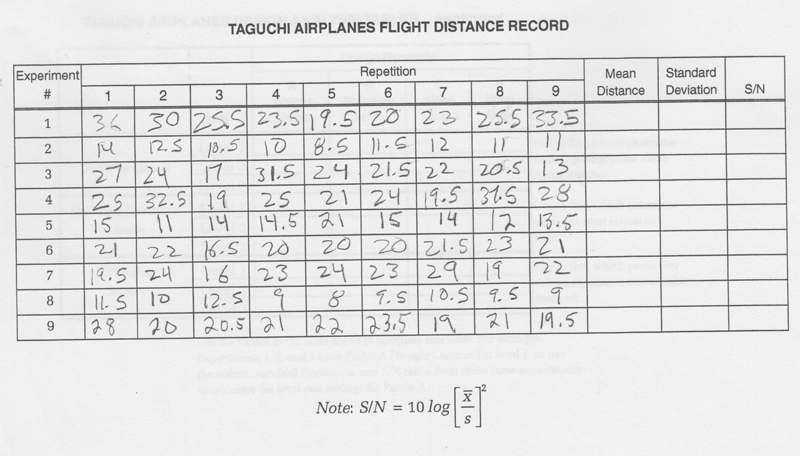
As Alexandra indicates in the video, the data collection for the lab activity began with flying the planes down the hallway and measuring the distance using 12”-by-12” floor tiles. Those measurements were communicated to Alexandra, who penciled them into the “example chart” provided by the professor (see Figure 3 at right). The distances recorded in the paper table were taken back to the lab and “plugged” into an Excel table to quickly calculate the mean distance and standard deviation for each different configuration of the plane, thus allowing Alexandra and her teammates to understand the performance of each version of the plane regarding distance and consistency.
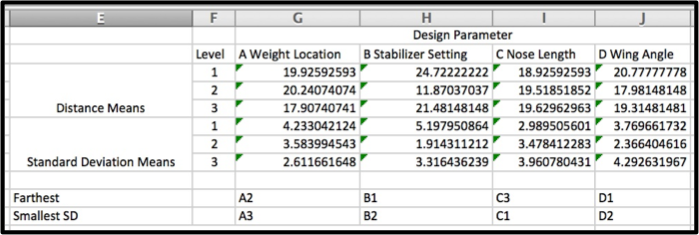
The data from that initial Excel table were then incorporated into a series of other tables that represented the distance and standard deviation of the flights with respect to each of the four design parameters rather than individual planes. Finally, data from that series of tables were combined into a single Excel table (see Figure 4 below) the team used to draw conclusions about which parameter had the largest impact on flight performance in terms of distance and consistency. A version of this table was then included in the team’s lab report submitted a few days after the lab session.
Figure 4
Alexandra's Flaying Plane Master Data Table
(Click to Enlarge)
In addition to serving as a means of recording data in a succinct and economical manner, the tables that Alexandra and her teammates act with for the lab activity serve a variety of the functions documented in situated studies of scientists and engineers (Goodwin, 1994; Latour, 1999; Latour & Woolgar, 1986; Roth, 2003; Roth & Hsu, 2010).
First, tables drive perception by orienting users’ attention toward particular features of the phenomena under scrutiny that are of interest to a particular group. In this sense, tables serve as an “externalized retina” (Lynch, 1988, p. 202) of a profession that illuminates substantive properties of the object under scrutiny that are relevant to the interests of a profession or group. For Alexandra and her teammates, the tables they acted with for the lab activity, and later for the major design project, structured and ordered the world according perceptions identified with engineers by making salient key features of the airplanes’ performance visible, including the various design parameters and how they informed flight distance and consistency.
In addition to driving perception, tables also drive the work schedule for observing and collecting data. They serve as a memory aid for data already collected as well as a schedule for accomplishing work that still needs to be done. In Roth’s (2003) words, tables function to both “suggest what activities have been completed” and offer “a plan for future activities that have as their goal the completion of an empty cell in the table” (p. 242). For Alexandra and her teammates, the tables they acted with for the lab activity served as memory aid of the data they collected from the 81 separate flights and a reminder of the need to calculate the mean distance and standard deviation of those distances and to draw conclusions based on those results.
Acting with tables also allows users to coordinate information from multiple other inscriptions (Latour, 1987, 1990, 1999; Lynch, 1988). Latour’s (1990) notion of a “cascade of inscriptions” (p. 40) addressed how data and features from one inscription are taken up, transformed, combined with other data, and re-represented along an entire chain of inscriptions. The initial Excel table Alexandra mentioned, for example, was assembled from a series of earlier inscriptions, including the grid formed by the one-foot-by-one-foot tiles of the hallway floor that provided the distance measurements and the hard copy version of the table provided by the professor. That table, in turn, was translated into a whole series of additional tables and eventually a series of x and y line charts represented in the team’s lab report.
Finally, tables function as what Roth (2003) referred to as “conscription devices” (p. 18), inscriptions which “serve as the material grounds over and about which sustained interactions occur, and which serve in part to coordinate these interactions” (p. 18). Throughout the four weeks Alexandra and her teammates worked on the design project, they devoted no small amount of time talking over and through these and other tables, both face-to-face and via phone and email, as they were created and interpreted.
In another interview, Alexandra indicated that prior to the lab activity for Introduction to Engineering, her academic coursework had provided fairly limited instruction with creating and using tables in Excel. The only instruction she had received came in the form of a computing applications class she took at a local community college during her junior year of homeschooling that introduced students to the basics of using Microsoft Word, Excel, and PowerPoint. Describing the class in relation to what she was doing in the Introduction to Engineering lab, Alexandra stated, “I learned how to do some of this [building and using Excel tables], but it was on the old version of Excel. … We did not have to produce our own data, either. We used data that was given to us and we just had to toy with it and make it look pretty.”
Prior to that, Alexandra indicated that she “had not done very much with Excel” except for what she referred to as “little things” with her family. As an example, Alexandra stated, “Like, there was this one time my dad was explaining to us about our budget, to the three kids, and kind of showing us percentages of like what went to the mortgage, what went to savings, and blah, blah, blah. I think he even made it into a pie graph.”
Based on her analyses of the developing genre knowledge of two engineers, Artemeva (2009) concluded that “some ingredients of genre knowledge can be taught in a classroom context, [but] for the knowledge to become active and for the individuals to be able to apply this knowledge successfully, it needs to be complemented by other genre knowledge accumulated elsewhere” (p. 173). As Alexandra’s comment about her encounters with tables and graphs to understand the family budget indicates, her knowledge of acting with tables was complemented by interacting with the tables and other inscriptions that animated her family’s interactions. In the sections of this chapter that follow, we partially trace Alexandra’s acting with tables for a variety of those “elsewheres,” including playing a video game, managing her schedule, writing fan novels, and solving puzzles.