05. Diagram as Boundary Object
Incorporating Visuals into WPA Practice
When I arrived at the Rochester Institute of Technology, new leadership was happening across campus: there was a new president, a new provost, a new dean of the College of Liberal Arts, a new chair of the English department and, with my hire, a new FYW director. The Institute Writing Committee had just been moved under the auspices of the provost’s office, elevated in its charge, and was now chaired by a rhetorician in the English department who had Writing Across Curriculum (WAC) experience and included in its membership the writing center director from Student Affairs. Two weeks before I arrived on campus, a team of faculty and administrators had returned from an American Association of Colleges and Universities retreat where it had articulated an enthusiastic vision for a WAC initiative. There was a clear and present buzz of excitement as the Institute aspired to become a center of innovation and inquiry in writing support for the region, the country, and internationally.
The Institute Writing Committee chair, who had been arguing for a comprehensive WAC program, was poised to see her efforts actualized. The two of us were having meetings with campus decision makers, writing up proposals and creating budgets, strategizing about how to develop an exciting, intellectual, and technologically mediated “Writing & Research Center.” Our efforts were going well until a discursive misstep confused a vice president, the modest budget became “a concern” about allocating resources, and the chair of an academic senate standing committee was “nervous” about communicating such large, structural changes. We needed a new strategy to help focus our discussions and provide more clarity for our vision. How quickly momentum toward the goal of deep and meaningful writing support can wither along the path toward implementation.
Knowing that specific decision makers would be reluctant to read even the most succinct written proposals, my colleague encouraged me to create a visual to help us make our arguments. This was a straightforward suggestion, especially considering the history of “mapping” in WPA scholarship. For example, Tim Peeples (1999) and Chris Anson (2002) both provide compelling arguments for the importance of “mapping” in administrative contexts. Peeples’ (1999) asks: “How should a WPA address the great diversity of theoretical perspectives, pedagogical approaches, and multiple constituencies that legitimately reside within writing programs?” (p. 164). To answer his question, he turns to what he calls “postmodern mappings” in order to “better situate ourselves and programs within the dynamic, fragmented complexities that are academic institutions” (p. 165). Chris Anson (2002), similarly, begins his chapter, “Figuring It Out: Writing Programs in the Context of University Budgets,” by arguing,
Mapping, or creating visual representations of ideas, is a useful way to understand the budgeting process because budgeting is by its very nature categorical, with funds being allocated from various sources and for specific kinds of expenses. […] Mapping also creates bridges between numbers and operations, between abstractions of math and material, educational, and human elements of a writing program. (p. 234)
Attempting to take their approach, I started the process of creating different maps to help me translate what I understood about the RIT context for writing instruction and what my disciplinary training and experience had shown me about writing instruction and structures of support. Those representations, and the multiple revisions I made to them, helped me to understand the institutional context I was now working within, and helped me identify different categories of writing-related activities and the relation between those activities. In this chapter, I focus on two specific visual diagrams that I designed and then used as the basis for creating meaning and consensus with valued stakeholders around a new comprehensive WAC program. In what follows, I argue that the two diagrams played a key role in my WPA practice by serving as a “boundary object” (Bowker & Star, 1999) that fostered the regular reconstruction of meaning about writing instruction and support among stakeholders, and coordinated the perspectives of those stakeholders toward a shared purpose.
Analytical Narrative Diagrams
My first attempt to create a meaningful diagram was purely a means to put ideas onto paper, and looked like a three-circle Venn diagram. My second attempt was not much better. I used a PowerPoint flowchart template, but felt limited by the flowchart grammar that required each of the elements to be presented in hierarchical relationships. Still, with each iteration I was developing my understanding of the work: what elements needed to be depicted on the map, what relationships needed to be emphasized, and what might be the unintended implications of the visual. Finally, using Microsoft SmartArt, I was able to design two diagrams. The first presented my conceptualization of the then current model of writing instruction (Figure 1). The second presented my revised “model for enhancing student writing at RIT” (Figure 2). Emphasizing the sequential aspects of writing curricula and what I believed were important structural elements of support for the curriculum, my hope was that the diagrams would tell a story of how impoverished the current model for writing instruction was and how there could be a better way. The two diagrams, placed as part of the introductory material of our written proposal, were meant to establish the context in which the actionable policy language would serve as a mechanism for significant change in the culture of writing at RIT.
As Höllerer et al. (2018) explain, “The crucial point is that diagrams enable a new way of thinking, a new, spatial logic, on the one hand open to interpretation, on the other hand authoritative” (p. 111). Although the “Liberal Arts Core Requirement” established the general contours of writing instruction at RIT, I wanted to create a new way of thinking about writing instruction in the institute. The first diagram, Figure 1, lists four categories of activity— “placement,” “writing in the first year,” “other writing requirements,” and “graduation” requirements—all presented in rectangles of different colors, with two categories fully shaded in to highlight their consistency: the “placement” process and the “writing in the first year” curriculum that students were placed into. Because the writing center had been supporting students from any program, it is also fully shaded in, though because it was not intentionally connected to any specific writing curriculum, it is placed between rounded-corner shapes that were not consistently part of a student’s writing instruction after their first year. Through the use of shading, vector arrows, and shape placement, I was telling the story of a semi-structured writing curriculum that was not consistent or seemingly intentional. In policy (i.e., “COLA requirements” and “3rd Year Review [IWP]”) there were attempts to articulate meaningful, coherent practice; but, in practice, there was not much consistency.
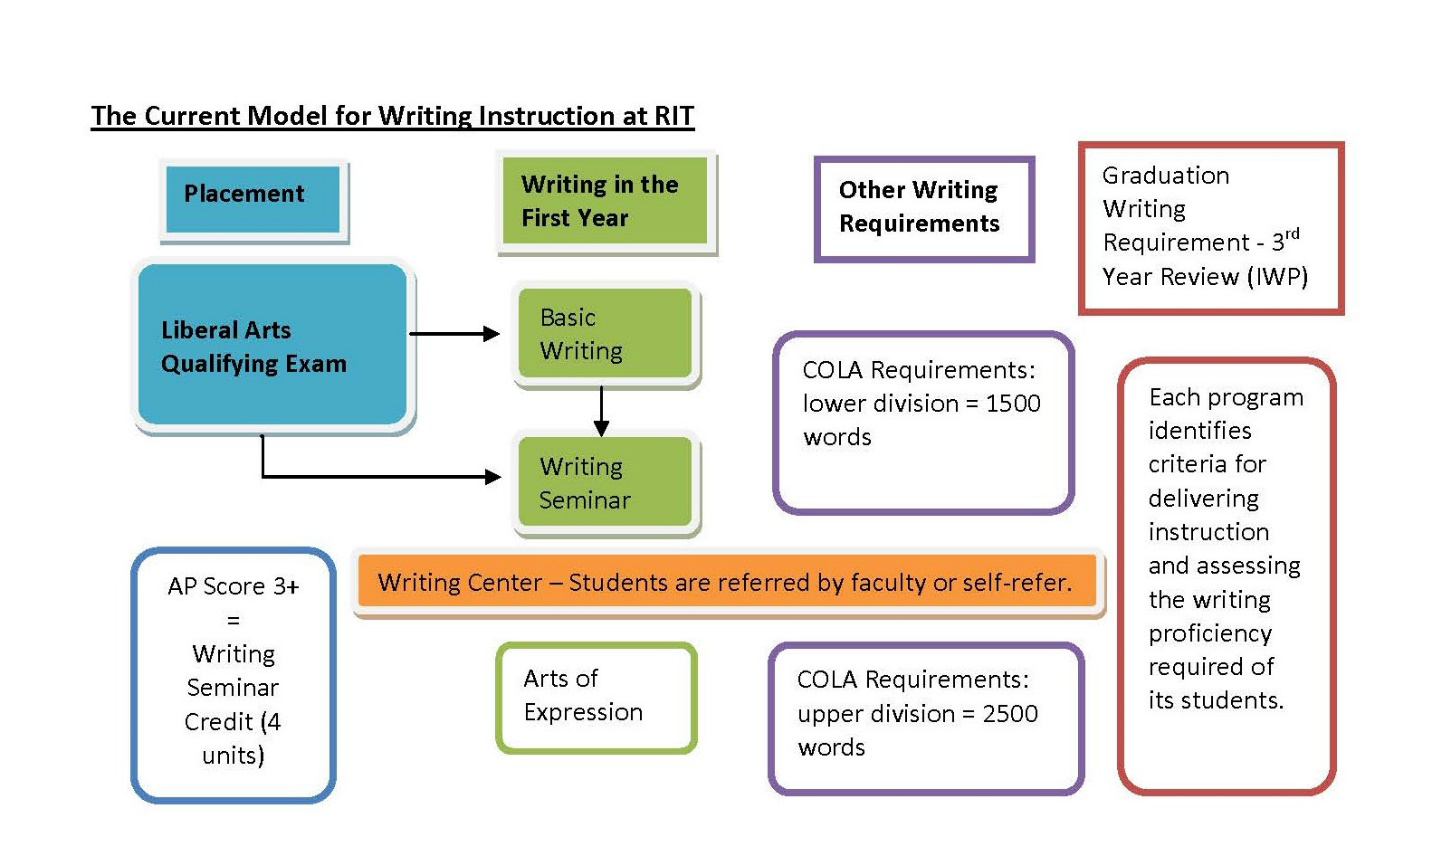
Figure 1. The Current Model for Writing Instruction at RIT
For the second diagram, Figure 2, one of the key elements that I wanted to highlight with colorful shading, within the grammar of the first diagram, was how the “comprehensive” model for “Enhancing Student Writing at RIT” would establish important coherence and consistency in the structural elements. References to the significant oversight components (e.g., the First-Year Writing Director, the Institute Writing Committee [IWC], the General Education Committee [GEC], and the Intercampus Curriculum Committee [ICC]) also identify other institute governance structures that would play key, specified roles in improving writing instruction at RIT. Vector arrows highlight the direct connection between specific curricular elements and the proposed “Center for Writing & Research” that would directly support “Writing Intensive (WI)” courses. Directional arrows suggest planned progression of writing instruction from students’ first year through general education and to their program WI courses. Additionally, “Comprehensive Writing Assessment” is meant to represent a firm foundation of the entire WAC model. Thus, in this new model, with all component activities fully shaded in, the diversity of constituent activities are seen as coherently and consistently aligned. The only unshaded element, the “AP Score Policy,” is also ringed by a dotted line to suggest that this policy was under review.
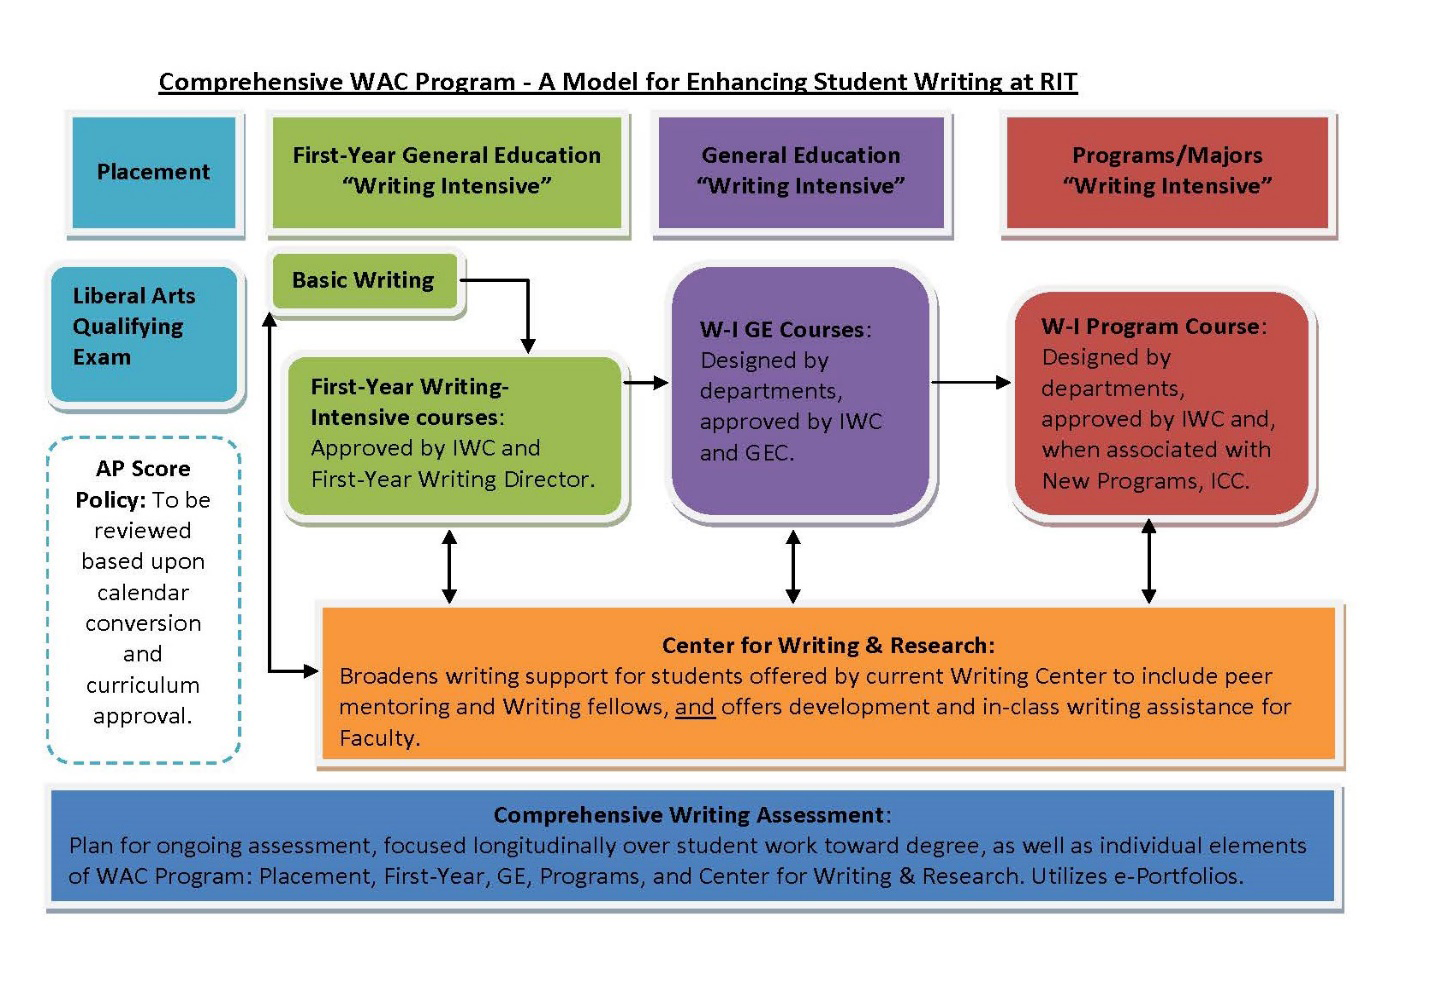
Figure 2. A Comprehensive Writing Across the Curriculum Program - A Model for Enhancing Student Writing at RIT
I was careful when designing the diagrams to create what could be seen as a rational system for the support of the new writing curriculum. I worked hard to align what I saw as the goals of the Writing and Research Center to be built on a foundation of assessment and continuous improvement to support faculty in the delivery of WI courses, and students in the successful completion of those WI courses. From my vantage point, there would be direct, deliberate, and recursive links between the different components of the curriculum. My varied experience as a WPA and my training in rhetoric, composition, and literacy studies had given me a strong sense of curricular structures and the support mechanisms that might be built around the curriculum.
As diligently as I was working to represent what was possible, the work of Etienne Wenger (1998) offered a helpful reminder that the diagram of the new Comprehensive WAC Program was a “reification,” a result of “the process of giving form to experience by producing objects that congeal this experience into ‘thingness’” (p. 58). By creating these diagrams, I was “not merely giving expression to existing meanings, but in fact creating the conditions for new meanings” (p. 68). With the diagrams in hand, because they created “a specific ‘layer’ of organizational reality that becomes performative and impacts perception, thinking, and practice” (Höllerer et al., 2018, p. 104), I was able to have conversations with stakeholders focused on the opportunities for a new approach to writing instruction the diagrams represented. While the process of their creation was key to the pedagogical work the diagrams would eventually facilitate, the more impactful work came when I used the diagrams to focus conversations with stakeholders on the proposed changes.
Boundary Encounters
As WPAs collaborate with university colleagues to address a broad range of issues, they work with people who typically operate within other, distinct communities of practice—for example, staffing of sections, hiring part- and full-time faculty, designing curricula, conducting performance reviews, planning budgets, developing new writing support for specific student groups, providing faculty professional development, reviewing transfer and AP credit, assessing unit effectiveness, and so on. Those distinct communities of practice, if identified by their function, can include offices of human resources, strategic planning, accounting, benefits, payroll, and assessment, along with writing program faculty, faculty from other disciplines, and faculty governance committees. As WPAs collaborate on these varied aspects of higher education management and administration, they also participate in the creation of new communities of practice that form and stay active around specific projects or questions, or can be established and do its work for longer periods of time.
By presenting categories of information used by a variety of different communities of practice, both diagrams function to facilitate dialogue between constituent groups. For example, both diagrams use the names of specific categories of courses (e.g., Arts of Expression, Basic Writing, Writing Seminar), identify relevant university entities (e.g., COLA, IWC, GEC), and establish relationships between these different courses, entities, and other activities that are guided by WPA best practice (e.g., relation between assessment and curriculum design, relation between Writing and Research Center and support for students in specific courses). Because the diagrams contain such a range of old and new information relevant to various stakeholders, they provide a common point of departure for discussions around the proposed program structure.
Operating from a common point of departure, the diagrams function as what Bowker and Star (1999) have called “boundary objects”:
Boundary objects are those objects that both inhabit several communities of practice and satisfy the informational requirements of each of them. […] The creation and management of boundary objects is a key process in developing and maintaining coherence across intersecting communities. (p. 297)
One clear example of a boundary object comes from Tony Mirabelli’s (2004) discussion of a restaurant menu. In his discussion, Mirabelli demonstrates how the menu becomes the focus of restaurant interactions between servers and customers:
How to describe something to an individual customer and satisfy their private appetite requires not only the ability to read the menu, but also the ability to read the customer. […] In such events the meaning of the menu is continually reconstructed in the interaction between the waitress or waiter and the individual customer, and as a text [the menu] functions as a “boundary object” that coordinates the perspectives of various constituencies for a similar purpose (Star & Griesmer, 1989, p. 130) (p. 151)
Although my diagrams never functioned like a menu to help satisfy one’s appetite, they certainly did provide interaction opportunities in which key stakeholders were able to work through and continually reconstitute the different meanings and understandings of what they wanted writing instruction on campus to look like. As a boundary object which serves “to coordinate the perspectives of various constituencies for some purpose” (Wenger, 1998, p. 106), the diagrams enabled a specific kind of encounter with members of other communities of practice.
Although I had been collaborating with others on the preparation of the proposal for a different kind of writing support structure, our attention had mostly been on what was to be included in the proposal, and what the diagrams should represent. To learn what different stakeholders believed and understood, I made the meaning of the diagrams the focus of recurring discussions, rather than a fixed explanation of the new structure. I distributed copies of the diagrams to different stakeholders and requested meetings to discuss their understandings of what the new comprehensive WAC model represented. As my encounters revealed, four major stakeholders all had different, though related, understandings of the diagrams.
When I met with the senior associate provost, for example, her position as a decision maker highlighted her distinct perspective and kinds of information she needed within her community of practice. In response to an early draft of the diagrams she demonstrated her expectations of what the diagrams would need to depict:
[You have] a lot of information here, and I am wondering if there was another way to simplify that. Do I really need to know that [pointing to one component of the visual], as a decision maker? I want to know that there is a way of being flexible in deciding whether students only take writing seminar or whether there will be some accommodation for programs that want to offer up the possibility that another kind of course could substitute for it. That’s what I want to know as a decision maker.
The senior associate provost put pressure on the diagrams to present relevant information needed by decision makers clearly, consistently, and quickly. For her, too, the diagrams needed to demonstrate to other stakeholders with specific interests that there was flexibility in the model of support, as well as the potential for accommodations to their interest. Ultimately, the associate provost explained, “I need to know the principle. I need to know it is possible. And I need to know someone is going to be responsible for it.” In this way, the senior associate provost played her role as both a sponsor and a gatekeeper. Her comments also highlight how others might make sense of the diagrams. Making sense of the diagrams from the vantage point of an upper administrator/decision maker draws attention to other interests that were ultimately taken for granted and removed from the diagram; for example, how is placement conducted and what resources are needed to conduct placement? Who is responsible for assessment? What resources are necessary for that work? How is the staffing, delivery, and funding of general education WI courses different from that of program WI courses?
Another stakeholder I met with was the assistant provost for undergraduate education, who was responsible for overseeing the delivery of general education. In our conversation, he was more focused on implementation and how the program would impact students once implemented. For him, the diagrams provided assurance that there were processes and people in positions to address quality of education and support. As he expressed it, the comprehensive model diagram (Figure 2) depicts a “clear student path.” During our discussion, the assistant provost described ways that the diagram communicated the strength and pervasiveness of what he called “quality control structures.” The assistant provost’s perspective was reassuring and drew attention to how those curricular and support structures addressed the needs of different constituents, whether they be administrators, curriculum committee members, faculty, or students.
The diagram suggests that a writing and research center would offer something more or different from the current writing Center, namely, peer mentoring and writing fellows, ongoing professional development and in-class writing assistance. Ultimately, the discussion with the assistant provost highlights our deliberate alignment of curriculum and writing support, focused attention on how the new structures utilized people already providing writing instruction and support and demonstrated the ways that assessment evidence would be instrumental in determining both the success of the curriculum and support.
The meeting with the writing Center director promised a different set of complications. The diagram of the “current model” implicated the writing center he directed as not fully addressing what would become the new support needs on campus, and the proposed model initiated an overhaul and expansion of the writing center into a “WAC Writing & Research Center.” In his capacity as member of the Institute Writing Committee, he had been involved from the beginning in discussions about the new center, but he had not articulated his personal concerns. In our one-on-one conversation, though, he expressed significant anxiety about his vulnerability as a staff member. Depending on how the new WAC Writing & Research Center was formed and what his role in it might be, he was not confident that he would have a job if the proposal were accepted. When we met, he focused on how the WAC model revealed an absence within the current model. In his comments, for example, he described how, “the visual shows contact points.” In response to the absence of arrows to or from the writing center in the “current model,” he asserted that, “the visual reveals slips in communication. Students leave the writing center and communication ends.” Thus, while the diagram was clearly effective in displaying our intended meaning, the discussion revealed multiple meanings resulting from the implications of the proposal.
The symbolic aspects of the two-diagram narrative, in which two approaches were compared to show deficiencies in one and strengths in another, was intended to construct a specific understanding that would lead to a cultural shift. Until I spoke with the writing center director directly, I was not entirely mindful of the ways some stakeholders might read different meanings into the diagrams. Although he had identified the “slips in communication,” he also read the diagrams to represent significant, potential changes to his job. Deliberate consideration of the interpretations, whether by conversations with stakeholders about what meaning they make of the visual or by reflecting on how people likely have different interpretations based on their role and position, invites attention to how stakeholders are positioned by and within the curricular and support structures WPAs create and use in our daily work. In addition to the concerns about resources, the writing center director’s experience demonstrates how his feelings of vulnerability warranted attention. Discussing the diagram with him, I was able to understand and address his concerns directly.
Conclusion
At the time I was having these stakeholder conversations, I was focused on what I learned so that I could improve the diagrams and make a stronger argument. That is, I was focused on the artifact of the diagrams. Reflecting on my experience, a few years after the comprehensive WAC model was unanimously approved by the academic senate and after the provost resourced writing instruction through the creation of a university writing program, the story of my conversations with stakeholders demonstrates how co-authoring visuals with collaborators makes the visuals themselves a topic of essential learning and meaning making. Similarly, as boundary objects, such visuals are co-constituted among collaborators, stakeholders and, in this case, myself, and therefore play an important pedagogical role in design. Incorporating visuals into WPA pedagogical practice with administrators and colleagues helps us not only to translate our understanding of writing curriculum and curricular support structures to stakeholders and to present our disciplinary values, knowledge, and beliefs to stakeholders, it also helps us understand what stakeholders value, know, and believe.
Throughout the university there are many such boundary objects that “both inhabit several communities of practice and satisfy the informational requirements of each of them” and, at the same time, help to “maintai[n] coherence across intersecting communities” (Bowker & Star, 1999, p.297). As WPAs quickly learn, each of those different forms and procedure documents require specific “naturalized categories” (p. 296) of information that other community of practice members use in their processing or completion of their work. Sometimes the learning curve is steep and sometimes, because the WPA only needs to work with those forms and procedures intermittently, it is difficult to remember what is truly being asked for. At RIT, for example, the Institute Writing Committee—the faculty governance committee responsible for approving “writing intensive” courses comprised of faculty representatives and ex officio staff members—uses the “new course outline” form used by all curriculum review groups on campus to review and approve university courses. For search committees and human resource units, different boundary objects give focus and coherence to the process of hiring new faculty, and include documents like the “Job Description Questionnaire,” which helps HR determine the appropriate wage bands for new hires, and the “Requisition form,” which provides all the budget line, salary, unit, and essential responsibilities for the position. In these examples, the documents do not simply request or communicate information. As boundary objects, they coordinate how stakeholders understand and enact the goals and mission of the institution.