07. Is Teaching Just a List?
Toward Feminist-Humanistic Visual Representations of Being a Writing Teacher
How do we visually represent being a writing teacher?
As writing teachers and administrators in often dehumanizing institutional contexts, how do we represent the activity of being a college-level writing teacher? How do we multimodally represent being a writing teacher when we talk and share artifacts about teaching writing as a complex, meaningful activity that we value as a discipline?
By “being a writing teacher,” I mean the teaching of college-level writing as a robust professional activity—not just the labor of teaching. In First Semester, Jessica Restaino (2012) relies on Hannah Arendt to theorize new writing teachers’ labor, work, and action. Labor, Restaino reminds us via Arendt, is “an endless and repetitious cycle” (2012, p. 15) and laboring is an activity that “is never finished; it is the giant task of staying alive” (Restaino 2012, p. 14). Restaino asks, “what does ‘staying alive’ look like for the new writing teacher?” (2012, p. 15). Is it classroom management? Grading? The writing process itself? “having something to do each day with 20-something students?” (Restaino 2012, p. 15). As a feminist administrator-mentor, I extend Restaino’s questions to ask, when we represent being a writing teacher to newcomers, do we communicate that teaching is just labor? And is “teaching just” just labor—particularly when new teachers are working with diverse undergraduate students from historically underrepresented and systemically undersupported social groups?
Though our field has been committed to teaching writing since its beginnings and has in recent decades turned a great deal of attention to multimodality and visual rhetorics, our scholarship contains few visual representations of being a writing teacher (not to be confused with visual representations of writing as an activity). While administrators or instructors may create and circulate multimodal artifacts in individual programs, such lore does not get taken up in scholarly publication venues as worthy objects of analysis and agents of change. This chapter asks us, as a field, to consider how we represent being a writing teacher to newcomers and how our visual-rhetorical genre choices (or lack thereof) shape our relationships with teaching—not just for new instructors who are often new to writing pedagogies and college teaching, but also for ourselves as more experienced teachers, scholars, administrators, and mentors. After offering a brief overview of the intersections (or lack thereof) of writing program administration and visual rhetorics, this chapter shares and analyzes two artifacts that visually represent teaching writing, with an emphasis on generative questions they raise for administrators (current and future) and writing instructors (new and experienced). Ultimately, I argue that, while we could benefit as a field from visual representations of being a writing teacher, we should also be care-full to enact humanistic approaches to visualizing teaching as a means of feminist enculturation. Even though composition has been marked as a feminist or feminized field, feminist enculturation is still a salient need for us all, especially for newcomers who are precariously positioned within, and being enculturated into, institutions that are still pathologically patriarchal, hierarchical, and neoliberal even when they claim most—and attempt—not to be. One humanistic way into the process of feminist enculturation in teaching writing is for us to ask: How do we move toward feminist-humanistic visual representations of being a writing teacher? For whom? And why should we do so?
Visualizing the Humanist Work of Teaching Writing
For Radiant Figures, my co-editors and I examined a corpus of recent WPA scholarship, including a decade of WPA journals (2008–2018), oft-cited monographs and edited collections, and readings assigned in WPA graduate courses (a total sample size of 226 articles, chapters, and books). Perhaps unsurprisingly, 60%t of the corpus contained no graphical figures. In the remaining 40%, the predominant form of visual representation was the table (56% of all figures; Figure 1). In what we might call the tabular tradition of performing WPA scholarship, we have used tables to encapsulate list-like information to visualize and represent a variety of vital writing program work: plagiarism (Martin, 2005), ESL students (Sanchez, 2013), racialized implicit bias (Inoue, 2016), and multilingual students (Queen, 2017). Based on a distant reading of WPA scholarship tables (a total sample of 182 tables), I noted two crucial patterns. First, tables often serve the function of example or evidence rather than as a central object of analysis or means of communication and meaning-making. Second, the few scholars who have centralized the function of graphical figures in WPA work have done so in service of assessment, budgets, and enrollment, directed toward an outward-facing audience of other administrators on campus: tracking pass rates (Roen et al., 2002); mapping budgets (Anson, 2002); and tracking enrollment and grade distribution (Glau, 2002). In other words, when WPAs create tables, we attend to certain aspects of administrative work and create visual representations for certain audiences, while notably occluding others.
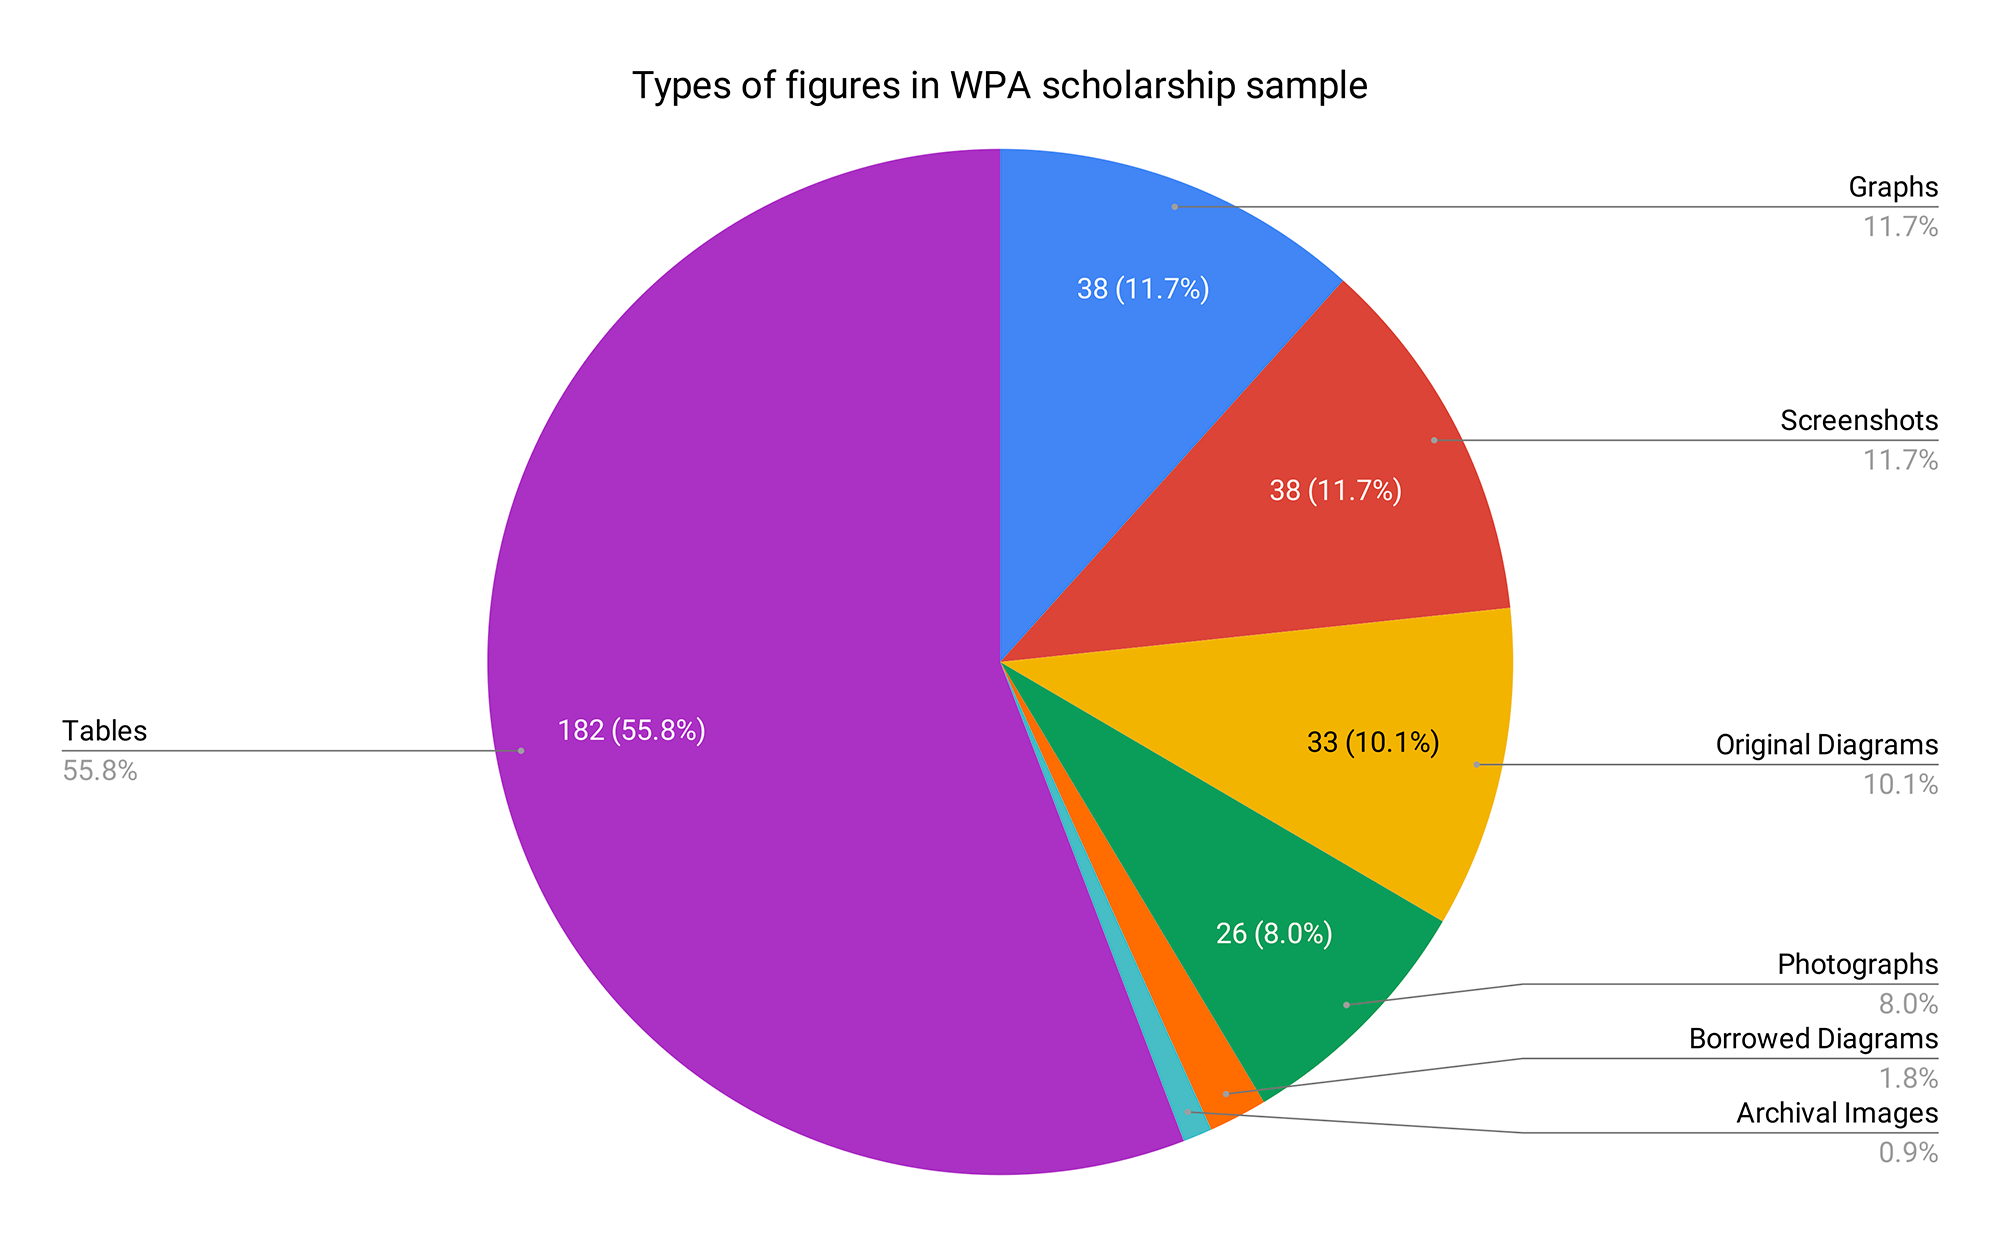
Figure 1. Types of figures found in WPA scholarship sample.
As a feminist WPA, I see two vital points emerging from this distant reading analysis: (1) a wariness of the tabular tradition (or any single approach); and (2) a query into intended audiences for WPA visualizations. Any disciplinary reliance on the tabular tradition should be interrogated as a habitual move for performing the humanist work of writing program administration. In “Cruel Pies: The Inhumanity of Technical Illustrations,” Sam Dragga and Dan Voss (2001) argue that bringing humanity to technical illustrations is a matter of ethical communication, that too often visual illustrations “constitute distortions of reality” with material consequences for both audiences and creators (p. 266). Dragga and Voss maintain that technical writers have a duty to “violate conventions and theoretical principles of design” in technical communication in order to complicate and humanize graphic displays (2001, p. 272). Most relevant to WPA data visualizations, Dragga and Voss maintain that there is an “equal obligation [of both the verbal and visual] to promote a humanized and humanizing understanding of technical subjects” (2001, p. 266, emphasis mine)—an obligation that the tabular tradition fails to fulfill. The verbal and visual limitations of a table constrain us to a limited conception of what kinds of information or data, represented in alphanumeric text, count as worthy of reporting,. For WPAs, then, we should ask: How can we create, complicate, and humanize graphic displays? And what are the consequences of not complicating and humanizing the graphics we create? Not only for other audiences, but also for ourselves as composer-administrators tasked with making meaning of our programs and their humanist work.
Further, we could benefit from creating and sharing visual representations of writing program work for internal audiences within our own programs, in addition to the good work we will invariably continue to compose for external stakeholders. In fact, doing so might be one way to shake loose our attachment to the tabular tradition and to shake up our assumptions about what data counts as worthy of reporting to whom. For instance, graphical figures in WPA published scholarship do not often enough stray from the usual suspects of assessment and placement data. What haven’t we attempted to show that might complicate our existing visual representations (both in scholarship and in our own program archives)? How might visualizing being a writing teacher help us resee the available choices in verbal and visual domains, as well as how and where those domains intersect and relate? As Bob Broad reminds us in “Strategies and Passions in Empirical Qualitative Research” (2012), we should be wary of fast and loose distinctions between qualitative and quantitative, demarcating “numbers” from “words.” Similarly, while Dragga and Voss add humanizing visuals to verbal representations, I would argue that even in the verbal/alphanumeric data we choose to represent teaching writing, we have a spectrum of humanized and humanizing choices to make.
As a feminist WPA-mentor, I take seriously the challenge of multimodally representing being a writing teacher as a means of feminist enculturation for newcomers. What do we choose to include when we describe teaching to newcomers? What do we exclude? At what kairotic moments? And why? Through such questions, we may render visible and interrogate the assumptions that we have internalized about core disciplinary activities (like teaching writing) and concepts (like labor, genre, and multimodality)—an interrogation that I hope is made transparent in the artifact analysis sections below.
Tabulated Labor
One disciplinary visual representation of teaching writing is Richard Haswell’s “Average Time-on-Course of a Writing Teacher” table (2005), nested under “Professional Resources” in WAC Clearinghouse’s CompPile archive. As a scholar committed to quantitative approaches to composition research and as a WPA invested in making labor visible in relation to instructor positionality, course load, and writing course caps, Haswell asks, “In numbers, what is the work required of a teacher in a typical first-year writing course?” (2005, n.p., emphasis mine). Relying on the WPA’s tabular tradition to visualize one possible response, Haswell’s table offers five categories of “work required” (Figure 2):
- A. Individual evaluation of four out-of-class papers (commenting and grading)
- B. Other evaluation and diagnosis (in-class work, student conferences, portfolios)
- C. Total evaluation time (converting minutes to hours)
- D. Other work for the course (class prep time, in-class time)
- Sum total (231 hours per course) (2005, n.p.)
| A. Individual evaluation of four out-of-class papers (per student) | ||
| Each paper assignment, original commenting | 20 minutes | |
| Each paper assignment, reading new drafts, grading | 20 minutes | |
| Total minutes per paper | 40 minutes | |
| Total of four papers | 160 minutes | |
| B. Other evaluation and diagnosis (per student) | ||
| In-class work (reading essays, quizzes, exercises, etc.) | 30 minutes | |
| One required conference | 15 minutes | |
| Portfolio: individual assistance and final evaluation | 25 minutes | |
| Total minutes per student | 70 minutes | |
| C. Total evaluation time (25 students) | ||
| Summed evaluation per student (A+B) | 230 minutes | |
| All students in the class (times 25) | 5,750 minutes | |
| Converted to hours | 96 hours | |
| D. Other work for the course | ||
| Preparation time (two hours per one hour class) | 90 hours | |
| Teaching time in class (3 hours a week, 15 weeks) | 45 hours | |
| Total per comp section | 135 hours | |
| Summed hours devoted to course | ||
| Work with individual students (C) | 96 hours | |
| Other work for the course (D) | 135 hours | |
| Total time-on-course | 231 hours | |
Figure 2. Haswell's table quantifying the work of a writing teacher for a single composition course.
Then, in addition to the table, Haswell references two teacher time studies to remind readers that the table “is the most conservative estimate” (2005, n.p.), calculates the amount of overtime required for a teaching load of three writing courses, and concludes with a reminder about National Council of Teachers of English (NCTE) recommendations for writing course caps.
For any instructor or WPA invested in reducing or maintaining course caps in the onslaught of egregious institutional austerity measures, Haswell’s table fulfills its presumed purpose: providing quantitative evidence in visually digestible form to support NCTE’s recommendations for writing course sizes, and modeling one way to collect, quantify, and communicate that information to university administrators. At the same time, as a visual-rhetorical artifact, one of the few in WPA scholarship that focuses on the work of a writing teacher rather than other WPA concerns, Haswell’s table also raises vital questions that we could all benefit from answering: How do we tabulate the work of teaching writing? Is being a writing teacher just “the work required of a teacher”? This is especially important to reconsider when the “work required of a teacher” here is a construction of laboring that, in part, answers Restaino’s questions in the affirmative: Yes, teaching writing is “an endless and repetitious cycle” (15) of reading, commenting, and grading while also teaching and prepping (Figure 2) in ways that simultaneously flatten teaching as a professional activity and occlude student laboring in the process.
If, as Dragga and Voss argue, visual illustrations “constitute distortions of reality” (2001, p. 266) with material consequence for both audiences and creators, we would be wise to consider how tables distort and mis/communicate. While the primary means of communication in Haswell’s table is verbal, the construction of verbal elements is visually a long table, whose sections add up and add up, continually stacked as 31 rows and 3 columns of labor upon labor. For an administrative audience, we hope such data visualization might be clear and successful at communicating abundant workload. But for an audience of writing instructors, the table might serve as yet another reminder of the labor bombardment for which we are daily responsible and not adequately compensated. And for an audience of new writing instructors, for whom CompPile’s Professional Resources are also publicly available, might the first blank column communicate a misunderstanding that, once these items are tabulated and completed, the work of teaching college writing has been done?
Checked off the list. √
Haswell’s table and its guiding question together maintain a conceptual conflation between the “work required of a writing teacher” and the titular “time-on-course.” This conflation constitutes a distortion of the more complex realities of being a writing teacher in its occlusion—however necessary and rhetorically motivated—of other work involved in teaching writing as a robust professional activity. An artifact like Haswell’s table—if we have created or relied on any similar artifact or mental construction of teaching writing—assumes, reflects, and mis/communicates problematic thinking about being a writing teacher that we have worked decades to refute as a field. Most notably, it feeds the persistent institutional myth that the work of teaching writing is a task-based list. Teaching writing often requires lists, but we must be careful not to reinforce and perpetuate the misunderstanding that our entire job is list-able. As disciplinary experts, even when we feel compelled to clearly communicate a great deal of complex information, we must push against the reductive nature of any list as an end-point, as Tara Wood, Jay Dolmage, Margaret Price, and Cynthia Lewiecki-Wilson argue about disability in the writing classroom in “Moving Beyond Disability 2.0 in Composition Studies” (2014).
Further, Haswell’s table raises questions about another deeply ingrained myth of being a writing teacher: Is the work of teaching writing just individual teacher “evaluation” and “diagnosis” of individual student writing (Figure 2)? I am grateful to have asked this question, to rethink how I describe teaching both in speaking and in composing texts for new teachers and writing students. The activities of teaching writing in Haswell’s table are predetermined interactions between individual students and individual instructors in step with a relatively linear writing process (“evaluation,” “diagnosis of drafts,” “new drafts”) and a traditional unidirectional classroom environment. Not only do all students and their writing not operate with such linearity, but also such a construction occludes interactions that do not occur between individual, isolated teacherly selves and one student’s writing.
Ultimately, Haswell’s table illustrates how, as WPAs, we should be careful in how we communicate multimodal messages about teaching writing—because it is perhaps too easy to circulate distortions of being a writing teacher that are, to return to Dragga and Voss, neither humanized nor humanizing (2001, p. 266). In composing texts and speaking about teaching writing, we have an obligation to pay verbal and visual attention to aspects of being a writing teacher that are collaborative and meaningful beyond the task-based scope of a labor list dominated largely by individual teachers reading and grading individual student writing. Because there are other individual student and social group interactions that take—and are deserving of—time in teaching college-level writing, we should ask ourselves some exacting questions. Can a table make collaboration in teacher planning visible? Where should professional development appear on our lists? Can being a writing teacher be a tabulated list? Are the quantitative measures of diagnosis, evaluation, and time-on-course the humanized and humanizing numbers that matter?
Tabulated Failure
I ask these questions not to create a straw man of Haswell or his table or quantitative methods in composition. Instead, I ask them because discovering Haswell’s table as an attempt at visually representing teaching writing helped me to ask more exacting questions and, in attempting to answer them myself in visual form, to interrogate my own inclinations, assumptions, and mis/communications.
As a new WPA in a first-year writing program at a large Midwestern university, I started off by participating in the WPA tabular tradition before learning to ask the challenging questions above. Early on, I learned that my department conducted interviews for graduate assistantships and that faculty supervisors were tasked with articulating job descriptions to begin the interview. Most of the candidates were not-yet first-year master’s students who, if offered a first-year writing graduate assistantship (FYW GA), would teach a college-level writing course during the first semester of their graduate education. Before interviews began, I asked myself: How will we describe the position of FYW GA to newly admitted master’s students? Knowing that candidates have yet to take a graduate seminar, likely have not been enculturated into an academic workplace, and likely may not have taken a first-year writing course?
As a feminist teacher-mentor-administrator, I wanted to use my power, experience, and expertise to transform the interview process into a mentoring opportunity that might support newcomers in positions of precarity, before and during what might also be their first professional job interview in higher education. As such, I identified three priorities:
- fairness and consistency: offering the same description to all candidates;
- transparency and generosity: providing an artifact in writing before the interview, so that candidates might better prepare their own generative questions in advance;
- a humane welcome: giving an overview of the position that generates questions without bombarding newcomers with overwhelming information that is difficult to process without additional context and time.
So I sat down and made a table. Not because I had seen Haswell’s table (I had not), but because making a table is often my go-to move across domains of professional activity. My tabulating was somehow already internalized; I was already occupying the WPA tabular tradition before we identified it in our distant reading analysis. In making my “FYWP GA job details by number” table, I sought to show FYW GAs what work might lie ahead. In composing the first draft of this table (see Appendix A), I was reminded that institutions fail to compensate people adequately for their time and labor (a fact that entails ethical complications in any form of representation). Just as importantly, I also realized that there were other “details by number” that matter to newcomers—and to us all—that aren’t as neatly tabulated. Even in my preferred revision (see Appendix B), I created a series of failed tables that just didn’t tabulate or add up.
Thanks to my tabulating failure, I interrupted my inclination “to table” and interrogated my own mis/communications in representing the complex, intellectual, collaborative work of being a writing teacher. I questioned how much my own responses concentrated on the “endless and repetitious cycle” of laboring (Restaino, 2012, p. 15) while occluding other humanistic elements that I value much more as a feminist teacher-administrator. In looking at the table as visual representation, I was surprised by the discrepancy between how I had described teaching writing and why I still appreciate being a writing teacher.
If being a writing teacher isn’t a static set of labor statistics—and I would argue that it is not—then how might we better visually represent the story of teaching writing to newcomers?
Infographical Reenvisioning
Without relying on the tabular tradition or reducing teaching to a labor(ious) list, I needed to defamiliarize my own responses to two guiding questions: How would I describe what being a new writing teacher might look like at this institution? How will FYW GAs spend their time? To describe that situated work, I created an infographic organized into three categories (Figure 3):
- Semester Snapshot (course titles, number of projects, students, and weeks)
- Events out of the ordinary (orientation, observations, student conferences, Celebration of Student Writing)
- A “Normal” Week (teaching prep, in-class time, office hours, responding to student writing)
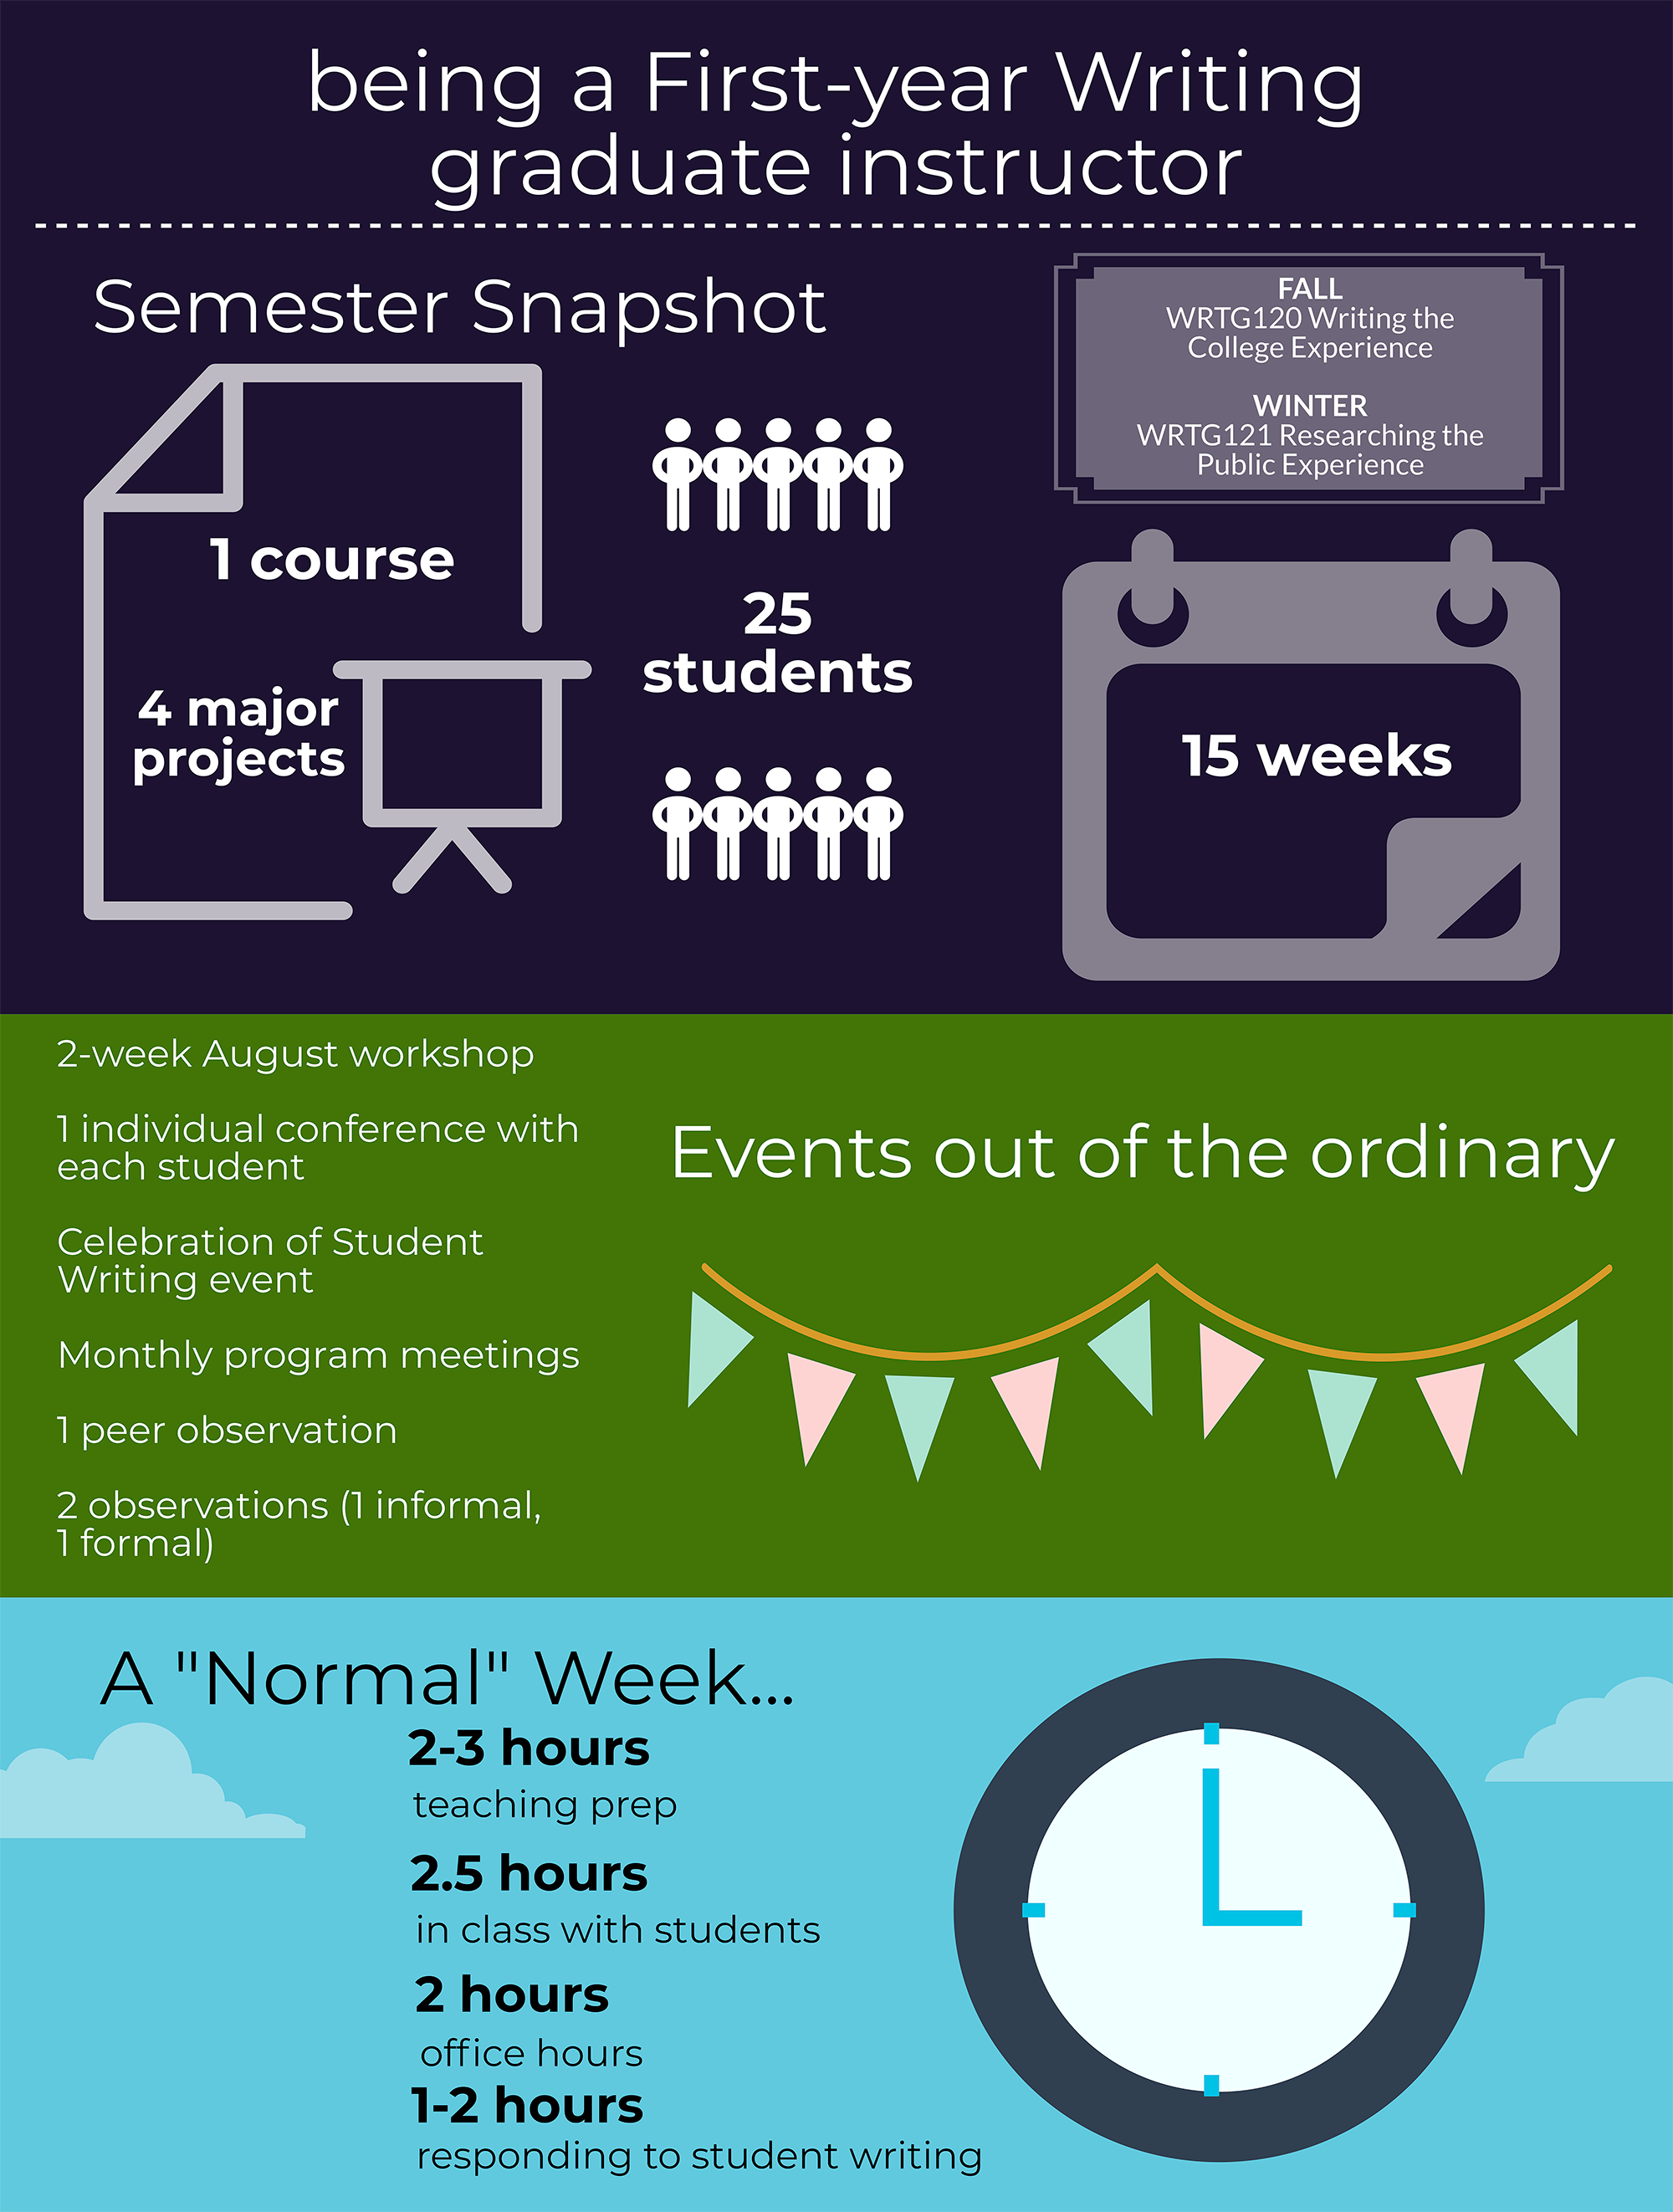
Figure 3. Infographic created for First-year Writing graduate student instructors.
This construction of teaching writing, from writing program directors to/for new graduate student instructors, aims to provide an overview of the position and to give enough detail to prompt further questions about specific aspects of the work ahead. The infographic’s dominant means of organization and communication is a temporal measurement using different units of time (semester, year, month, week), not quantifying time spent per student writing artifact or activity. For an audience of new instructors, while the quotation marks around a “normal” week cannot fully characterize the unevenness of writing teacher labor in evaluating student writing (which happens with each major project, but not each week), the infographic has traded that particular “distortion” of reality in order to illuminate what we can reliably promise that new writing teachers will do every week. For first-year master’s students who are entering graduate school for the first time and largely teaching for the first time, too, the infographic attempts to provide a humane temporal view of being a writing teacher in a (hopefully) legible, concrete unit, honing in on hours spent in a single week rather than zooming out to minutes spent per student per semester.
Just as importantly, the infographic centralizes in its middle section several verbal elements that underscore aspects of teaching writing that are supportive of teaching and not just required of teachers: orientation, professional development, observations. The infographic features these humanized and humanizing details to situate being a writing teacher as entering a community of others joined together through common professional practices, paying needed attention to aspects of work that are collaborative and meaningful beyond any tabulated checklist. Such details also serve to push back against the patriarchal labor hazing of (particularly new) writing teachers, the endless reminders of teaching’s lists of laboring. The inhumane details of grading are intentionally occluded in the infographic, exchanged for the gains of other aspects of professionalization that we value as a field and profession.
In its early iterations, the infographic still has several limitations in its attempt to represent teaching using visual and verbal elements that are humanized and humanizing. First, the infographic does not include all forms of support (e.g., the curricular component of the graduate pedagogy course that supports FYW GAs in their first fall semester of teaching). Further, the visual elements still rely on the dominant verbal elements to communicate meaning. For instance, the clock and the calendar require verbal descriptions to communicate information about specific units of time; and the 10 human bodies require the verbal description to communicate that classes might have up to 25 students. Finally, both verbal and visual elements can miscommunicate false assumptions. Arguably, there’s no such thing as a “normal” week in teaching college writing, just as no blue skies are guaranteed. And though the human figures are meant as a visual reminder that students are people and not just numbers, students are not all the presumably able-bodied versions of “standard humans” that the graphic representation assumes (a problem that Derek Mueller takes up in his chapter in this collection).
Part of these limitations are related to the tool used for the infographic’s creation, Canva. A graphic design tool website that offers multiple plans (free and paid), Canva is one available option for creating infographics, posters, fliers, and other visuals. Like other similar platforms or programs, Canva offers both templates and “blank canvas” options to begin, the ability to adjust artifact size and multiple ways to “chunk” space into sections, and multiple galleries of illustrations and photos. Like other similar tools for design, including Microsoft Word, its options are not endless, and the task requires time and patience in learning a new interface. While I found the learning curve in Canva to be frustrating at first (I had used it twice before), for this infographic I felt as though remaining (and new) frustrations were worthwhile because the administrative task was important enough to keep trying and keep tweaking.
In its initial delivery, the infographic seems to have accomplished its purpose: to offer informative rather than overwhelming details for new writing teachers, presenting more humanized and humanizing choices in both verbal and visual elements as a means of feminist enculturation and mentoring during first point of contact with new instructors. Perhaps just as importantly, for an audience of WPAs and writing instructors, the process of creating the infographic as a visual-rhetorical artifact has highlighted salient issues and questions. First, as WPAs, it is our responsibility to communicate that being a graduate student instructor does not just require work to be done by individuals, but also entails multiple means of collaborative support on offer at varying times throughout the process of new teacher enculturation. This both/and—both work required and support on offer—should be central to any representations of teaching writing for all instructors. Second, the creation of visual-rhetorical artifacts for internal program audiences can be a vital means of making meaning and asking questions to resee what we have normed, what we think we are communicating to others, and when our messages and values are misaligned no matter how well-intentioned. For instance, we can benefit by thinking about the relationship between teaching and time. What is a meaningful unit of teaching time? Is it “minutes per student per paper”? “Minutes per student”? Is it “hours per week”? “Hours over the course of a semester”? Creating the infographic enabled me to ask a new question about how I, as a WPA and writing teacher, conceive of how I spend my teaching time, not just as an individual instructor with individual student writing, but also as a collaborative learner in conversation with peers and students.
Concluding Questions
For any professional activity, we have choices in the data-stories we choose as well as how to represent them visually (or not). Our choices communicate to others not just what we do in terms of tasks, but what we offer and value in terms of collegiality and support. The process of making, interrogating, and revising visual-rhetorical artifacts can open up generative opportunities for us to resee not only new teacher enculturation in writing programs, but also tutoring in writing centers, student writing in the classroom, and activity in our majors, minors, and degree programs. Of this infographic iteration, I now ask myself: Are these the categories that matter? What else is missing? As a WPA, what changes would I make to create infographic versions of teaching writing for other audiences? What about infographic versions of other data that I presented as tables, charts, or graphs? All administrators and writing teachers can ask these and other questions, making the multimodal creation process their own using all available resources and technologies.
Creating and revising an infographic has been one generative means of showing myself, as well as new instructors, how I think about categorizing and somewhat quantifying being a writing teacher, who is involved in that work, when it happens, and what collaborative and reciprocal relationships make such challenging work so meaningful. As teacher-scholar-administrators, we would be wise to consider how we represent being a writing teacher, particularly to newcomers, and how our visual-rhetorical genre choices (or lack thereof) shape not just our relationships with newcomers unfamiliar with our field and commonplace practices, but also our own perceptions of teaching writing and how we communicate those perceptions to others in/across multiple modes. As a field, we should also consider the dearth of visual representations of being a writing teacher in our scholarship and other circulating or openly accessible texts.
Given these two closing calls, I end with questions rather than answers: As a field, where do we visualize the work of being a writing teacher? Where/when do we do so for the perpetual rounds of newcomers who enter our graduate programs and institutions each year? And if, as administrators, we are not taking advantage of multiple and multimodal means of representation, who is representing our programs to newcomers in ways that are not rendered visible to us?
References
Appendix A
FYWP GA job details by number (first draft)
| # of courses | 1 course |
| # of weeks per course | 15 weeks |
| # of students per course | 25 students |
| # of meetings per course | 24-26 days |
| # of hours spent in workshop / orientation before first term | 60 hours |
| # of hours preparing for teaching | 30-50 hours |
| # of hours spent in class with students | 30 hours |
| # of office hours | 30 hours |
| # of hours meeting with students in individual conferences | 4-8 hours |
| # of hours attending Celebration of Student Writing event | 2 hours |
| # of hours reading and responding to students’ daily/informal writing | 15 hours |
| # of hours reading and responding to students’ major/formal projects | 38 hours |
| # of hours spent in monthly professional development meetings | 3 hours |
| # of times you’ll be observed teaching your class | 1 peer observation 1 writing program administrator observation |
| # of courses you’ll teach each year | 2 courses WRTG120: Writing the College Experience WRTG121: Researching the Public Experience |
Appendix B
FYWP GA job details by number (first revision)
Semester Snapshot
| # of courses you'll teach | 1 course |
| # of students | 25 students |
| # of weeks per course | 15 weeks |
| # of days per course | 24-26 days |
| # of students' major projects | 4 projects |
| Fall 2018 WRTG 120 | Composition I: Writing the College Experience |
| Winter 2019 WRTG121 | Composition II: Researching the Public Experience |
Events out-of-the-ordinary
| 2-week August workshop / orientation before your first day of teaching | |
| 1 week spent in individual conferences with students | |
| Celebration of Student Writing event each term | |
| Professional development meetings once a month (up to 3 times per term) | |
| 1 peer observation and 1 faculty/writing program administrator observation | |
A “Normal” Week
| # of hours preparing for teaching | 2-3 hours |
| # of hours spent in class with students | 2.5 hours |
| # of office hours | 2 hours |
| # of hours reading and responding to students’ daily/informal writing | 1-2 hours |
Reading Time in a Term
| # of hours reading and responding to students’ daily/informal writing | 15 hours |
| # of hours reading and responding to students’ major/formal projects | 38 hours |