Path 1. Mapping in/as Administration
 As a field, we have relied on mapping and its intellectual history to re-think, re-see, and re-envision complex systems and sites. Chapters in this path explore how both new and experienced WPAs use mapping to visualize and circulate program histories and values.
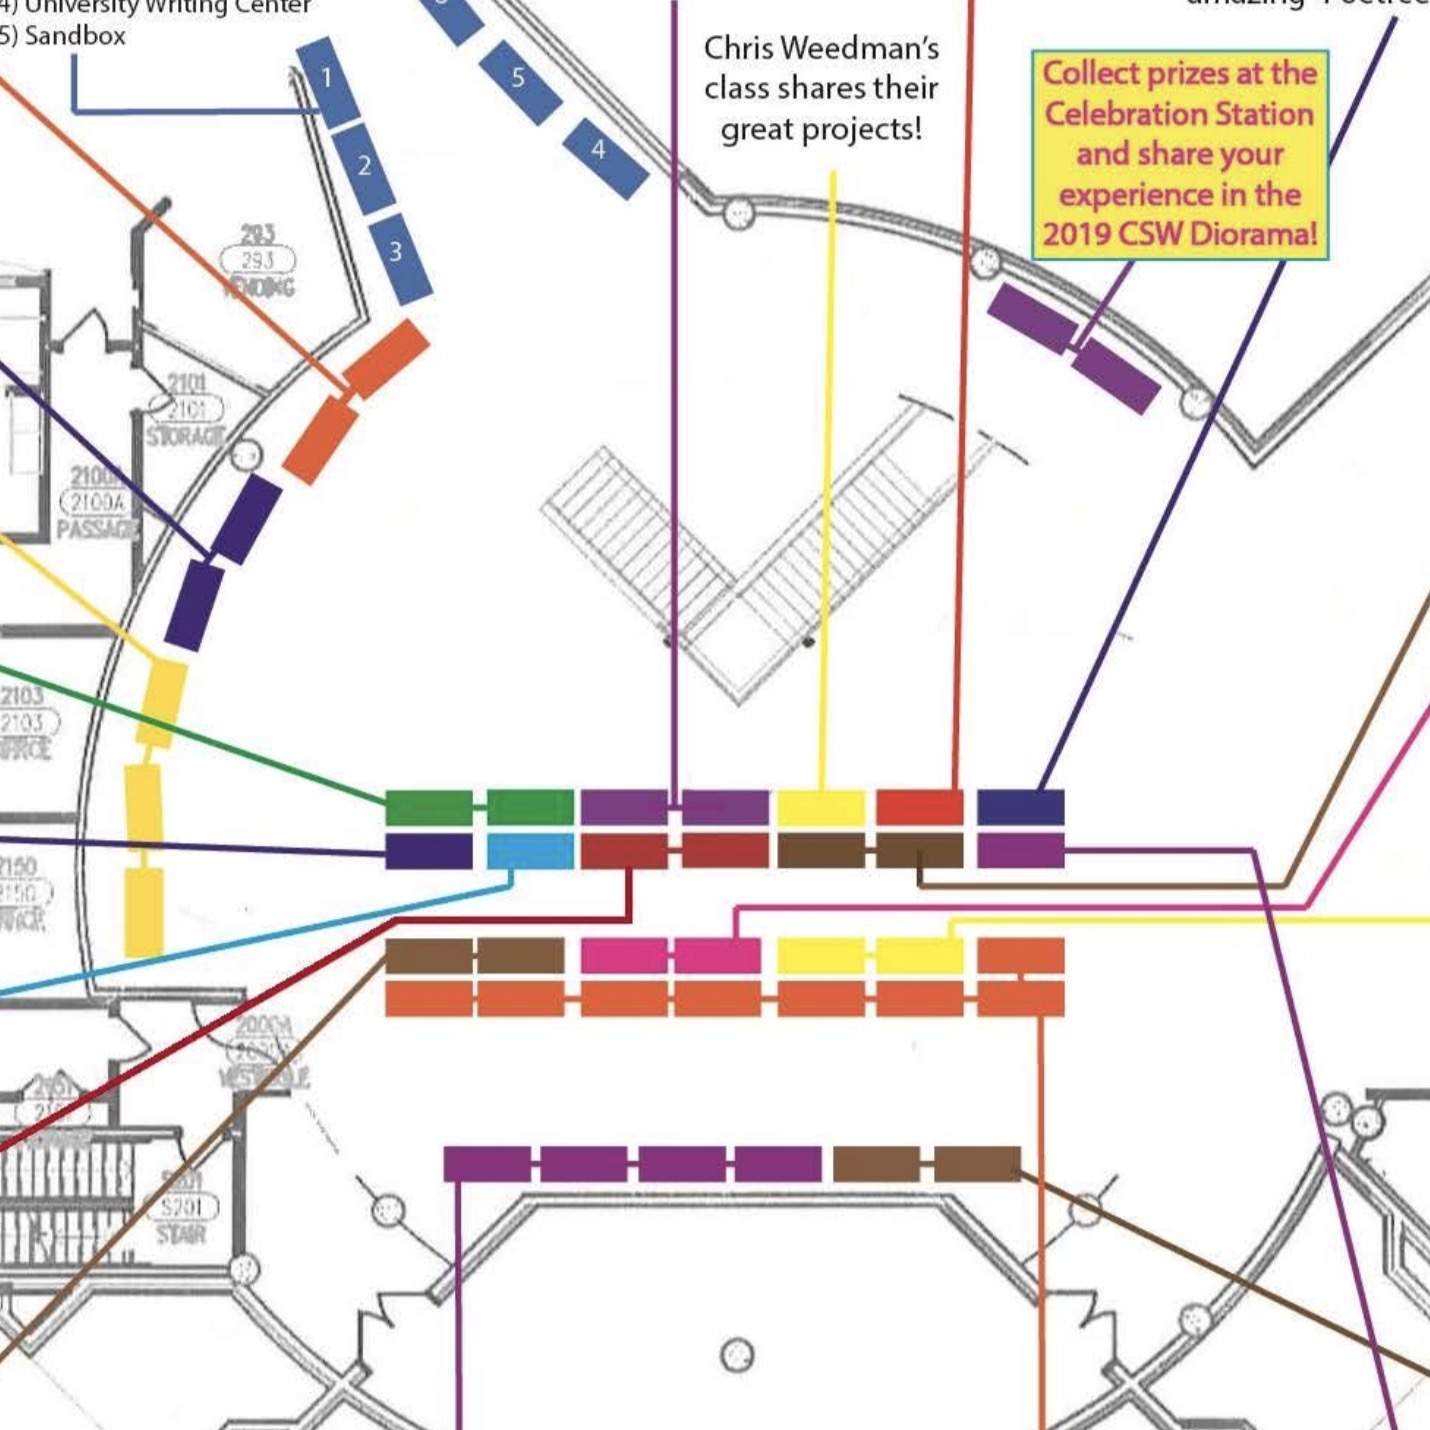
- 04. "WPA Responsive Genre Change: Using Holographic Thinking to Unflatten a Celebration of Student Writing," by Kate Pantelides, Jacie Castle, and Katherine Thach Musick
- 05. "Diagram as Boundary Object: Incorporating Visuals Into WPA Practice," by David S. Martins
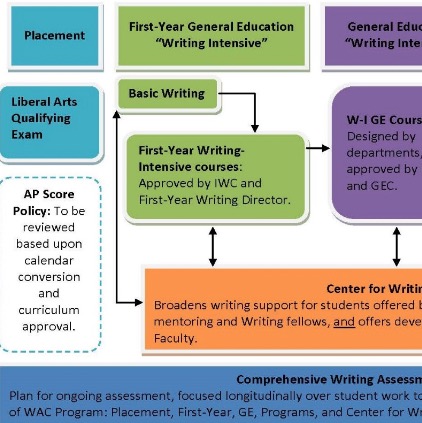
- 09. "Networks of Discourse: Using Network Mapping to Examine the Influence of Institutional Histories and Program Missions on Students’ Writing Development," by Jacob W. Craig and Chris Warnick
Figuring Writing Program Administration: Image🔄Word, Map🔄Metaphor (Response to "Mapping in/as Administration)" in Radiant Figures
When invited to participate in this book, I was hesitant, since I’m highly verbal and think of myself as untalented and unpracticed in visual rhetoric. But when I dug into files from my (long-ago) WPA practice and scholarship, I unearthed an unexpected wealth of forgotten maps and images. In this response I’ll examine some of these “found” figures and what I learned from revisiting them alongside the three chapters of this path.
I’ve assembled several sets of figures from the period of my most intense practical WPA work, the founding of the Syracuse University Writing Program (1986 to 1993)1 and subsequent WPA scholarship. Regardless of their origin—writings and talks for program teachers, administrative documents, WPA scholarship or classes—these figures and their texts were recycled and recontextualized for other audiences and remediated among oral, print, and (eventually) electronic forms. Like Martins’s revised curriculum map, they served as boundary objects for practice, scholarly, and administrative communities.
The first group includes four figures conceptualizing the writing program as an intellectual community. Figures 1 (Pattern of Program Development), 2 (Participants and Roles), and 3 (Writing Program Collaborative Organizational Chart) come from a strategic planning document addressed to the vice chancellor for Academic Affairs and dean of Arts and Sciences, proposing a vision of the program and its future development (Phelps, 1988b).2 Figure 4 (Publishing as a Function of Learning, Teaching, and Researching in the Academic Community) was a slide/handout used in a scholarly talk to a WPA audience (Phelps, 1989).
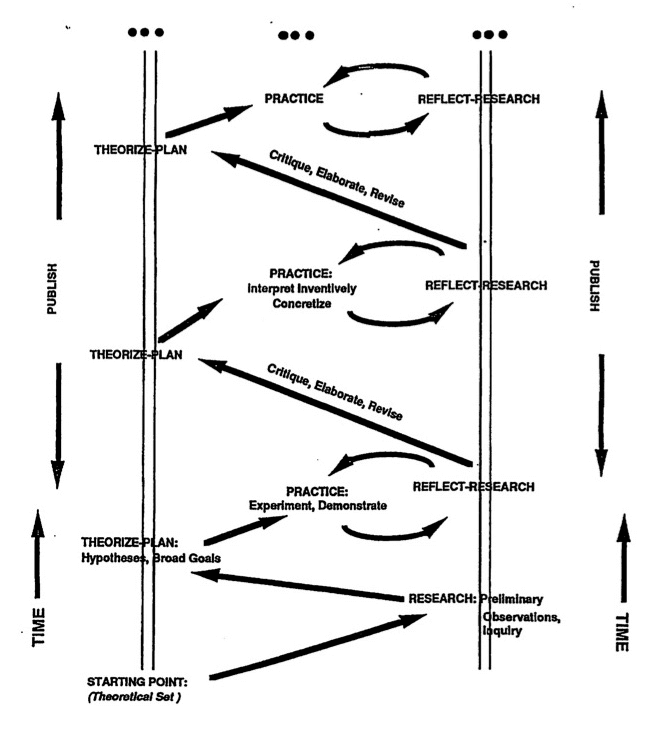
Figure 1. Pattern of Program Development
Figure 1 visualizes development of a writing program as an ongoing research enterprise, an infinite spiral of activity integrating theory, practice, reflection, critique, and revision (documented through “publishing”). The scope of publishing was expanded in Figure 4 to include undergraduate and graduate students, professional writing instructors, writing professors, and other university professors, all making their work “public” to wider and wider audiences, although in different densities as appropriate to their learning, teaching, and researching activities.
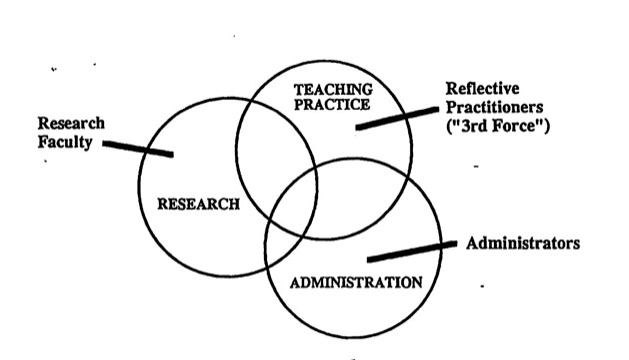
Figure 2. Participants and Roles
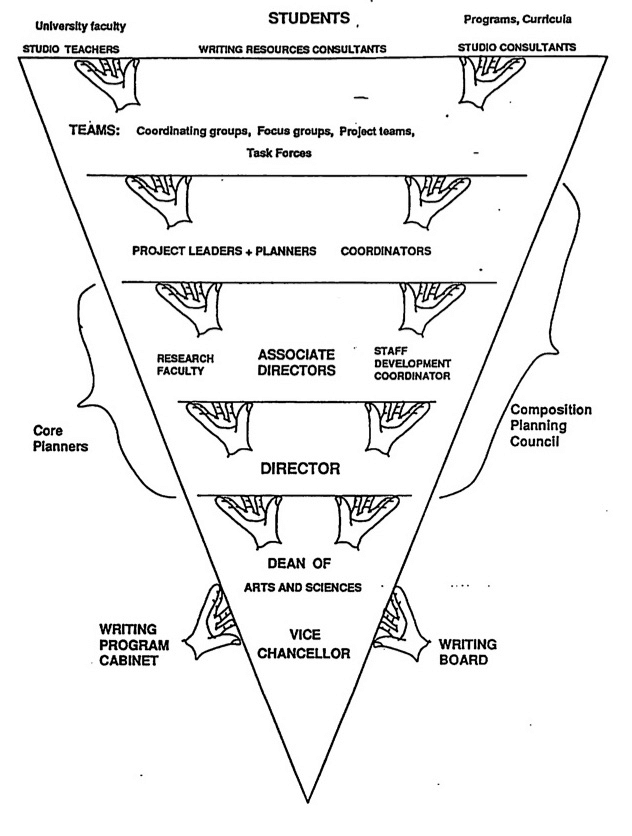
Figure 3. Writing Program Collaborative Organizational Chart
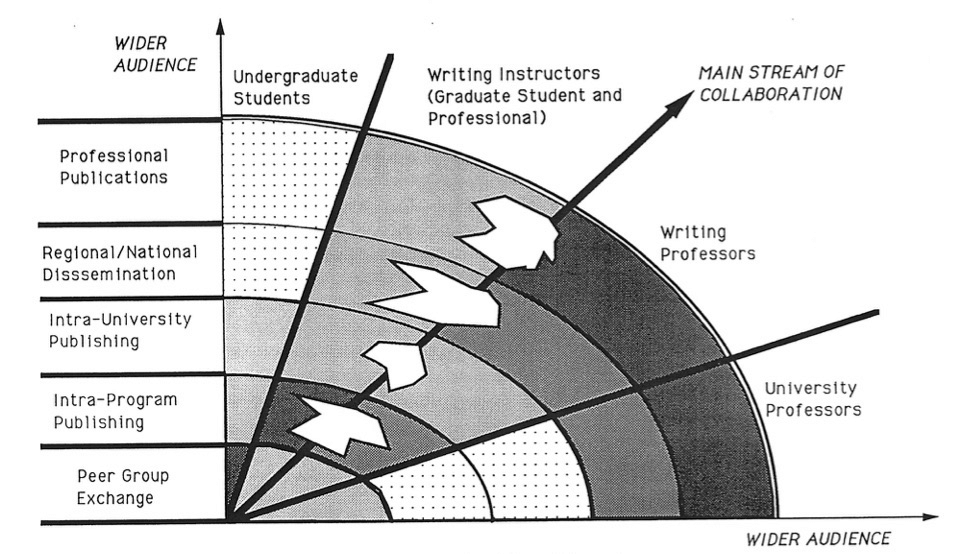
Figure 4. “Publishing” as a Function of Learning, Teaching, and Researching in the Academic Community
Figure 2 pictures research, teaching, and administration as overlapping, complementary roles that can be played (in different ratios) by members from groups that make up writing programs—research faculty, “reflective practitioners,” and faculty/staff administrators. Figure 3 (adapted from a management text) inverts the traditional hierarchy of academic labor, with each level supporting the next to meet the ultimate goal of enabling students in their own learning. It enlarges participants in that collaborative enterprise to include other university faculty and administrators.
Together these figures communicate two dimensions in this early design of the writing program. First, its basis in inquiry—understood as the commonality that links formal research, teaching, and student learning, along with writing as a means of inquiry and a medium for making one’s intellectual work “public,” open to judgment and use by others. Second, a “different ideal” of a hybrid, heterogeneous, diversely talented community whose activities are both parallel and symbiotic (Phelps, 1991). As the plan says, “the program views students, teachers, and scholars as co-learners who all contribute in their different ways to the creation, transmission, critique, and application of knowledge at the university and outside it” (Phelps, 1988b). These ideas are echoed throughout my scholarship not only in words, I realize now, but in other figures (see Phelps, 1988a, p.73 and 1991, p. 876).
Like authors of all three chapters on this path, I use(d) mapping heuristically, to work through ideas, but these figures were designed to persuade, in contexts of rhetorical exigence. I deployed them to try to transform program participants’ perceptions of themselves, their activities, their roles, and their relationships as groups and to persuade administrators (and, eventually, other WPA scholars) of the viability, ethical force, and practicality of this vision.
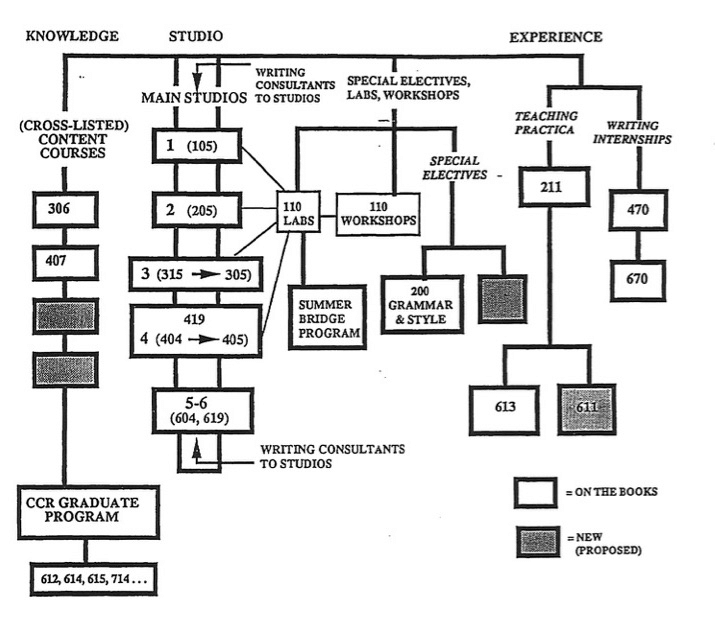
Figure 5. Writing Program Curriculum (Tree)
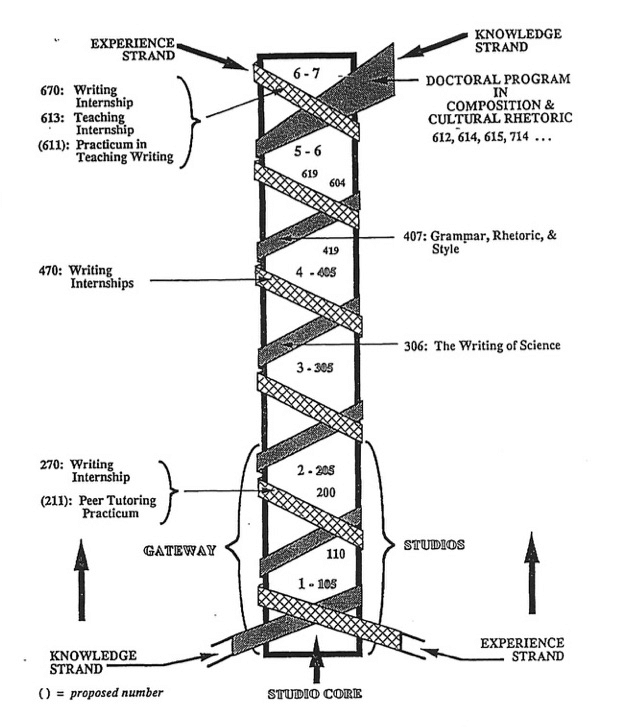
Figure 6. Writing Program Curriculum (Braid)
The next set of figures from the strategic plan translates this design into curriculum, clarifying its relevance to students. Figures 5 and 6 visualize the writing curriculum in alternate forms—Tree3 and Braid. Figure 7 (Studio Basics) is from “The New ‘Basics’ of the Writing Studios: Skills, Knowledge, and Judgment” (Phelps, 1988c).4 This diagram specifies two sets of activities by students as “basic” to studios, reclaiming the ideas of “basic” and “skills” from their identification with remediation.
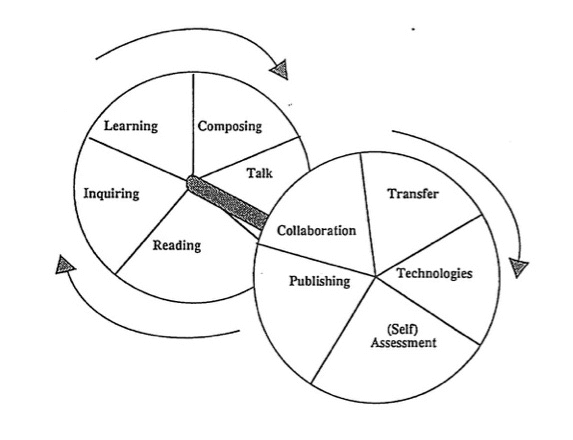
Figure 7. Studio 'Basics'
Like Martins, I sought to argue visually that learning to write exceeds “first-year writing” as a reductively defined “basic skill” and continues throughout the college years. But unlike his diagram visualizing a flow of students from first-year writing outward and upward into courses in the disciplines (general education and majors), my Figures 5 and 6 focus on how existing resources can be deployed for the writing program to offer its own developmental curriculum from first year through graduate studies. We named it the “spiral curriculum,” echoing Figure 1’s temporal spiral of inquiry for the teaching community. Figure 6 conceptualizes such a vertical curriculum as “braiding” interdependent strands of “experience” and “knowledge” courses around a core of studios that combines them. Reconciling conflicts in the discipline about different kinds of knowledge-making, this notion that a writing curriculum cultivates (and values equally) practical knowledge developed in experience and conceptual knowledge from studying language is echoed in Figure 7, whose text defined three fundamentals of writing as “basic” to studios: intellectual and symbolic skills, conceptual knowledge, and judgment
Other parts (and figures) in the strategic plan, however, projected growth of the program to include simultaneous development of a “co-curriculum” linking the writing program horizontally to writing in the disciplines—framing the program holistically as oriented to writing “over time, across contexts.” Figure 7 and its text tie the studios to this larger experience through their ultimate goal of preparing students to become “rhetorical inquirers” who will actively work to “transfer” studio learning to other contexts.
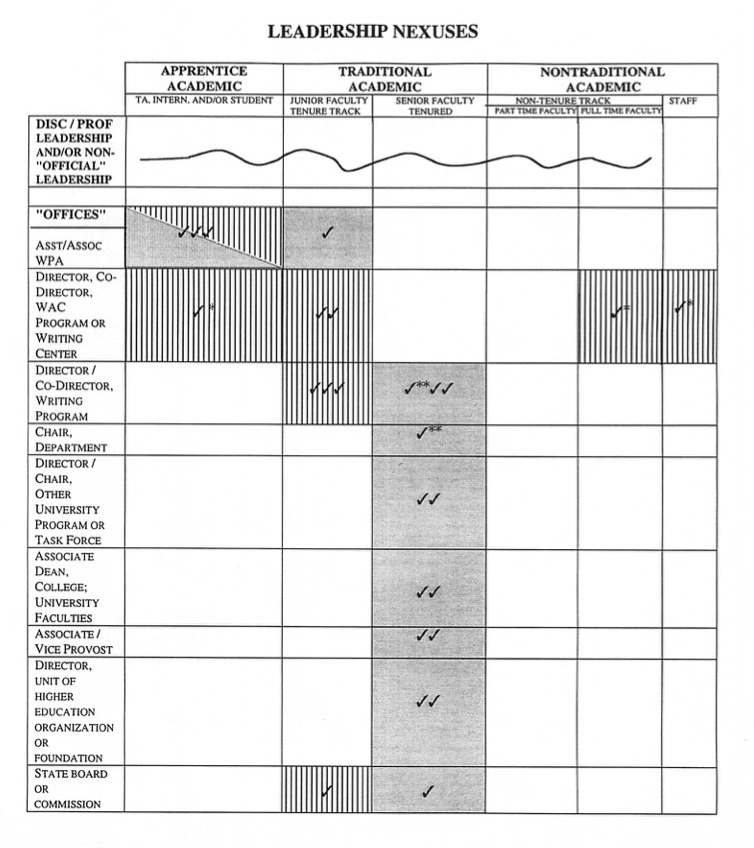
Figure 8. Leadership Nexuses
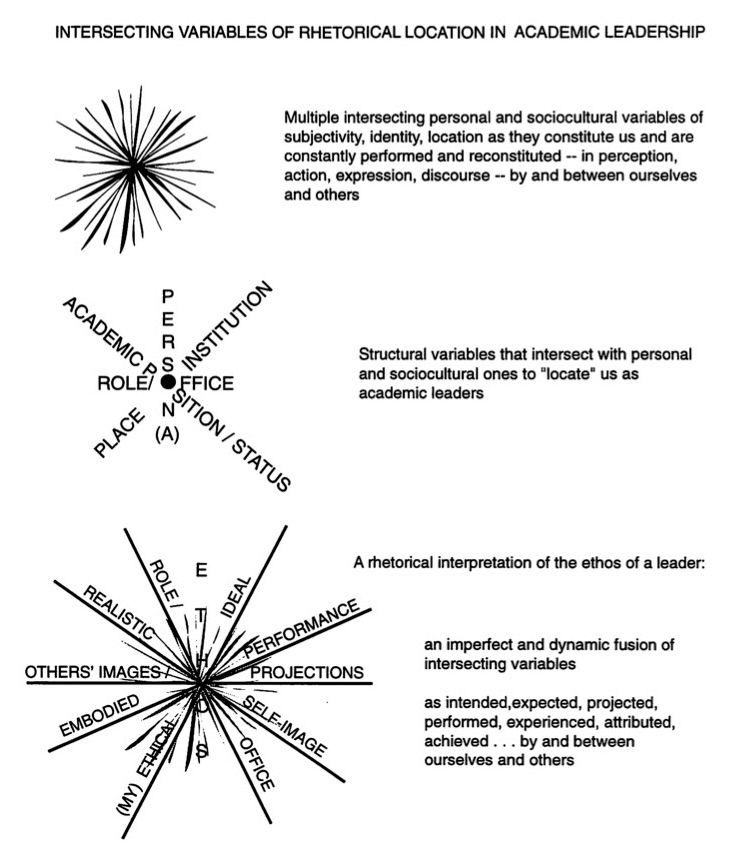
Figure 9. Intersecting Variables of Rhetorical Location in Academic Leadership
My next set of figures extends principles and advocacy from WPA contexts to reforming higher education as a system. Figures 8 (Leadership Nexuses) and 9 (Intersecting Variables of Rhetorical Locations in Academic Leadership) were among the slides/handouts I used to introduce an interactive session at a feminist rhetoric(s) conference. It featured five women—varying in generation, rank, and institutional roles—who had served in leadership positions: often, my maps demonstrated, from nontraditional locations where their responsibilities and ethos were inconsistent with their nominal status in the academic hierarchy (Phelps, 1999). It illustrates a position I argued in WPA scholarship (Phelps, 1995, 2002), that leadership can be exercised from any position, at any scale.
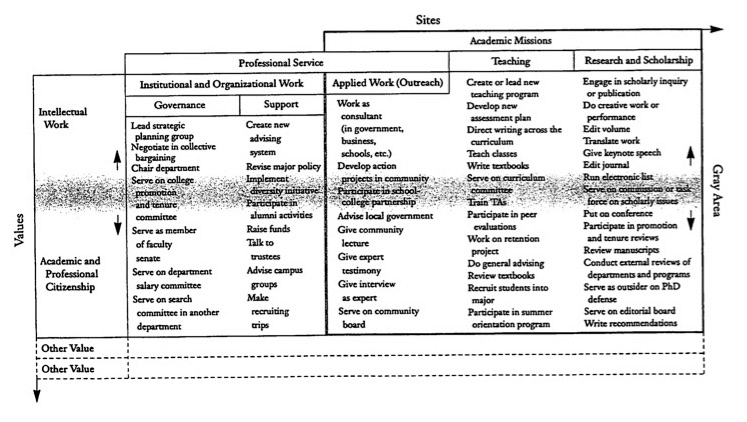
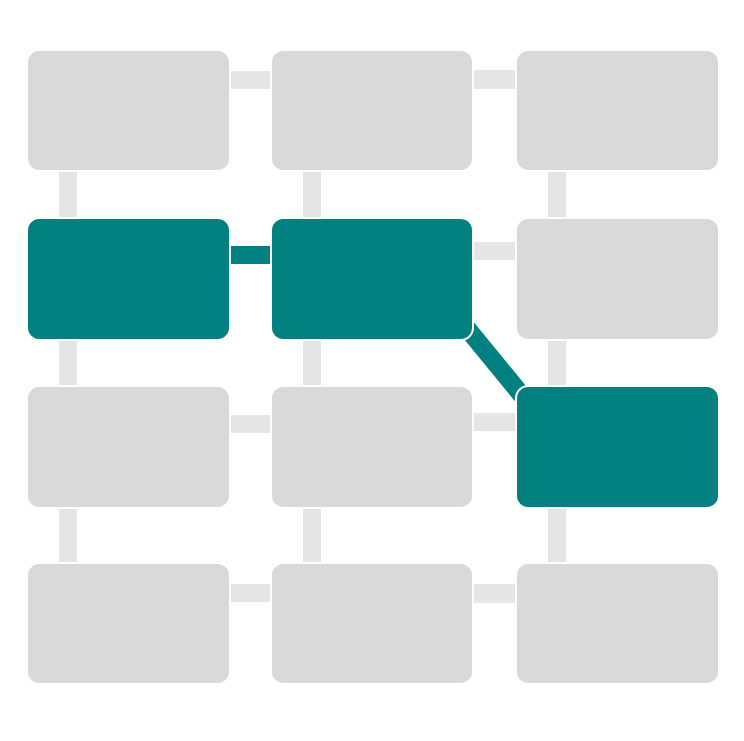
Figure 10. Mapping Faculty Activity Onto the Grid
Figure 10 (Mapping Faculty Activity Onto the Grid) is one of a series of slides I took to multidisciplinary conferences as a member of the MLA Commission on Professional Service while negotiating a radical new model of faculty work (MLA Commission on Professional Service, 1996). My slide deck took audiences of faculty and administrators through a sequence of geometrical transformations from the traditional model (a triangle privileging research) to a neutral grid (matrix) where faculty work could be mapped against academic values. Like Pantelides, Castle, and Musick’s diorama, audience members brought the grid’s spaces alive by filling it with their own and their colleagues’ activities. Doing so unsettled their adherence to norms about what should “count” as intellectual work, especially the invisible work of “service.”
Reconsider our figures now specifically as “maps.” Mapping makes patterns perceptible in analog form—typically visuals on two-dimensional surfaces—in order to grasp things as meaningful in terms of their relationships and emergent structures. Most of ours qualify as diagrams: abstract rather than literal, qualitative and conceptual rather than quantitative data visualization. What they visualize can be understood through the lens of Caroline Levine’s (2015) view of forms as abstract, portable ordering principles that organize ordinary life and social institutions just as they do texts and esthetic objects. Focusing on four socially significant patterns—bounded wholes, hierarchies, rhythms, and networks, Levine describes their valuable and harmful affordances, while attending to the ways they travel, overlap, collide, and mutually interfere at different scales, creating complexity that impedes the ability of any one to dominate and control.
Maps can iconically acknowledge or affirm sedimented patterns of social order—in our case, in academic institutions; but they can also challenge them—visually performing the “institutional critique” authors claim for two of these chapters. They can reveal the current order as dysfunctional, “flat,” ineffectual, disconnected, misconceived, or incomplete: as in Pantelides, Castle, and Musick’s original map of the celebration event, Martins’s diagram of the status quo in writing instruction, and Craig and Warnick’s network diagram displaying misalignment between the bridge program and the FYW program. They can make new maps to visually reinterpret, transform, or replace organizing patterns of academic life: respectively, a collaborative diorama that populates a space; a diagram reimagining all elements of writing instruction as a coherent whole; a Google slide deck highlighting actionable nodes from the network diagram.
This lens revealed how my own maps visually perform the same functions.
Many of my figures disrupt and undermine hierarchies. Among the binary oppositions and bureaucratic hierarchies they visually subvert are the class system of the academy (where nontraditional faculty are “second class citizens” and students are not knowledge-makers); the value triad of research/teaching/service; the devaluing of practical knowledge vs. theory; and hierarchical models of leadership. Some blur taxonomies, challenging divisions of complex realities into discrete categories, and complicate the reductive concepts and simple equations (of role and person, category and value) they enable. Visual shapes like matrices, spirals, braids, and starbursts and images of inversion, intersectionality, fuzzy borders, continua, fractals, and holograms are some ways I stretched to depict alternate patterns of social order.
The slide deck of geometric figures I used at conferences to deconstruct and reconstruct the traditional roles and rewards system was the visual, rhetorically fraught performance of the institutional critique undertaken by the MLA Commission on Professional Service. In presenting this project to writing program administrators (Phelps, 1996), I highlighted two metaphors that guided it (echoed in these three chapters): a “visual metaphor” of “making things [faculty work] visible” to change how they are perceived and valued; and a “conversation metaphor,” in which interactive mapping was used to generate conversation and debate (the process, not the result, was the point). However, the report reduces the visual argument to its result—two figures—one proposing the matrix model and one (Figure 10) mapping faculty activities onto it. The decision to exclude a figure mapping administration onto the matrix of faculty work reflects the commission’s rhetorical caution in working to transform the system from within, rather than directly attack its terms and norms.
The WPA role inculcates a keen sense of the underlying social architecture of academic life...of the ordering functions and dysfunctions of its forms, from the bounded wholes of disciplines to the rhythms of the semester and tenure clock. But it strained the limits of my visual competence to find or invent, much less produce, appropriate iconic forms to communicate the institutional patterns I perceived critically, or aspired to construct. Like Pantelides, Castle, and Musick, I was deeply frustrated with two-dimensional flatness, constantly reaching for ways to capture the dynamics of change over time, or the complexity of multiple variables in any event or process. I relied on collaboration with more visually minded family members to help me execute the figures I did dream up.
| Figure Type | Conceptual Models |
|---|---|
| Geographical-spatial | cross-border, network, horizon, path, location, boundary, domain, map |
| Sight | lens, gestalt, ambiguous figure, hologram |
| Music | polyphony, voicing, rhythm, keys |
| Embodied | dance, footprints |
| Material | weaving, braid, tapestry, Turkish rug |
| Nature | spider web, snow crystal, double helix, Olduvai gorge |
| Time | time’s arrow, Janus face, river |
Table 1. Pairing Figure Types and Conceptual Models
At the time I attributed my struggles to deficient spatial-visual intelligence, which I had come to terms with as a teenager. After failing at sewing from patterns, perceiving objects three-dimensionally through microscopes, solving geometric problems spatially, and interpreting geographic maps, I gave up dreams of a design career and concentrated on writing. But the role of visualization in my rhetoric looks very different if I consider the way images and metaphors populate my language in WPA work (and other writing). My figurative language both parallels and exceeds the visual ideas that literally became figures (Table 1). Many are geographic, spatial, or reference sight itself. Beyond visual, the greater semiotic range of my imagery—for example, evoking texture or polyphony—reflects how language itself is grounded in the perceptual and embodied foundations of human experience.
These observations belie the sharp distinction between visual and verbal rhetoric that some scholars have recently made (which has received strong pushback: see responses to Gunther Kress in a special issue of Computers and Composition [2005] that emphasize interactions, convergence, and reciprocities between word and image as well as hybridity and remediation among all semiotic modes). I “figured” writing program administration as much in my texts as in my maps, and one can easily imagine my imagery crossing over to become visuals, though not necessarily maps. An example from my WPA scholarship (Phelps, 2002) illustrates the holographic thinking championed by Pantelides, Castle, and Musick. Invoking the famous image of the universe as “turtles all the way down,” I described an ancient Turkish rug featuring turtles—its beauty ascribed to the density of its embedded patterns—as a metaphor for leadership as a fractal social form. But words can’t express such a quintessentially visual idea; it needed a photo of the rug.5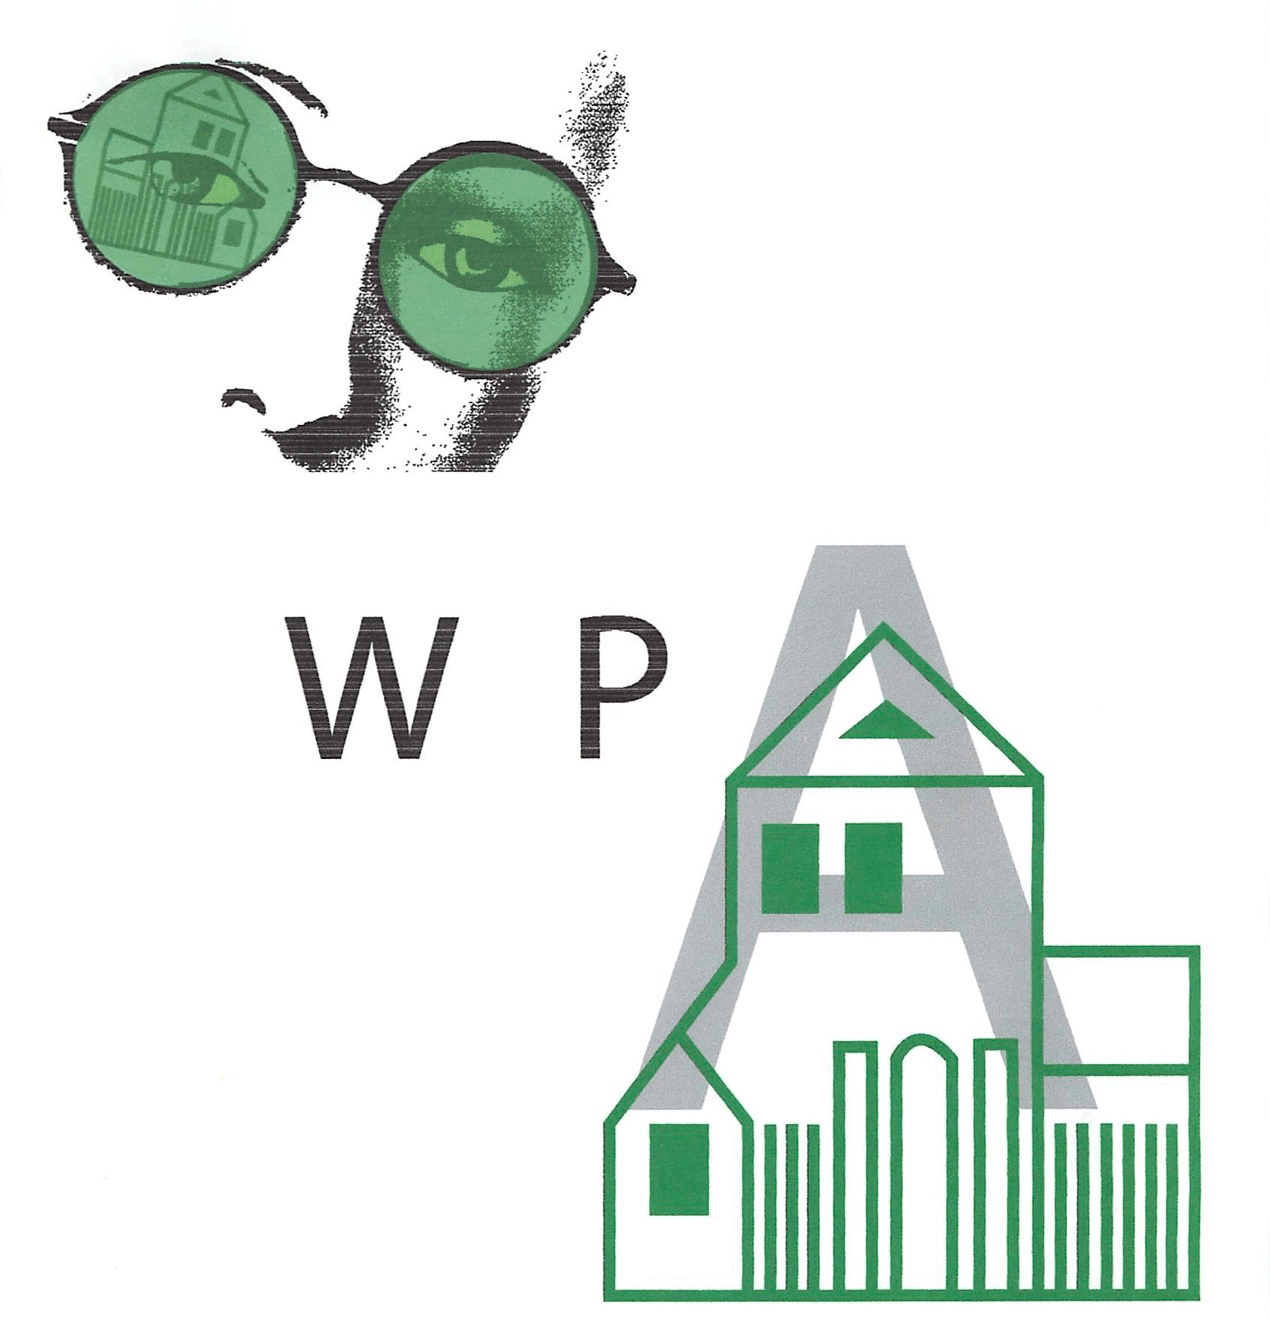
Figure 11. Administration as a Design Art
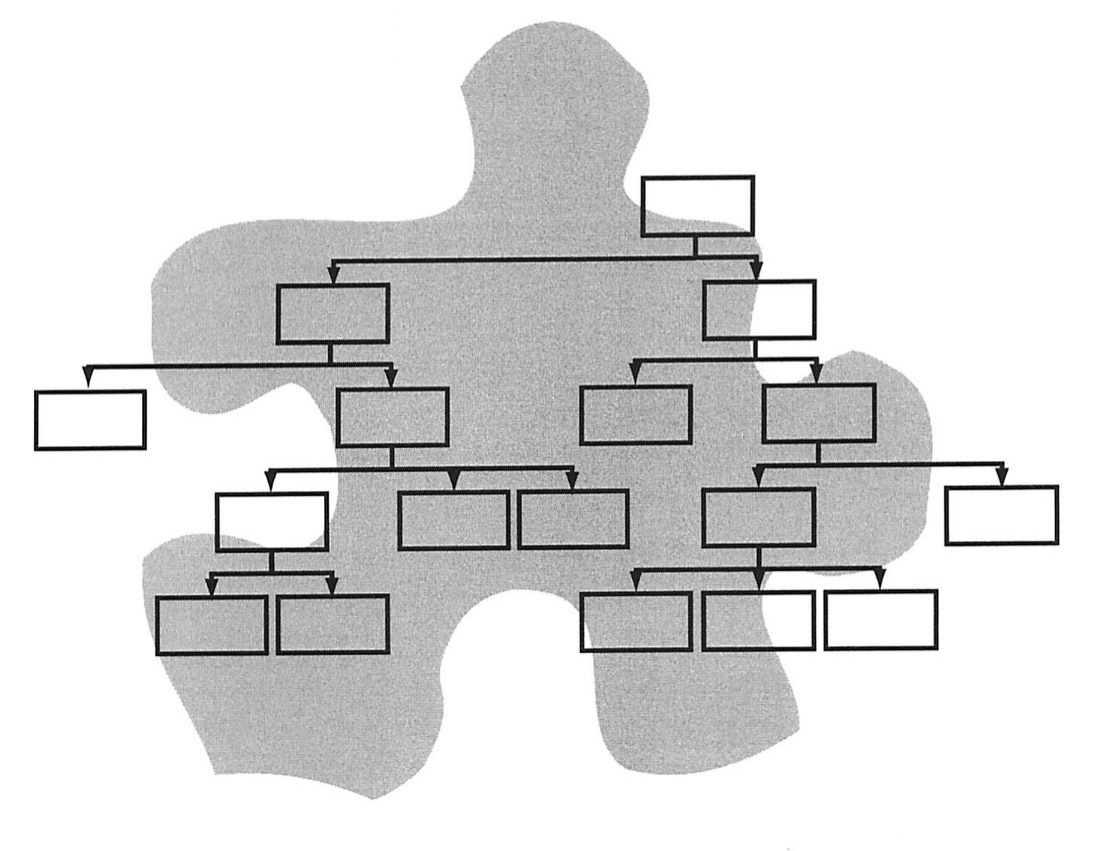
Figure 12. Bad Fit
I have long known, both theoretically and observationally, that word and image are not binaries: I remember objecting fiercely when my son was told he couldn’t be a writer because of “average verbal intelligence,” knowing that what made his writing special was his keen sensory observation and vivid spatial-visual imagery. I never write without drawing my ideas. Yet somehow I never let go of my own sense of being precluded from multimedia competence and, specifically, visual rhetoric, by my genuine limitations in handling visual-spatial information. My latent designer identity and habit of visual thinking went underground, but—I learned in this project—they’ve been there all along, not only in my language but in my WPA work itself. They surfaced most dramatically in a talk on writing program administration as a design art (Phelps, 2003). Putting on “design-colored glasses” to view writing program administration (Figure 11, Administration as a Design Art), it featured numerous images and maps. Among them are a photo of my file cabinet whose files demonstrate that everything in a writing program—not just a curriculum—has to be “designed,” and a map overlaying the hierarchy of an academic department on the irregular shape of a writing program (Figure 12, Bad Fit).
When I ask myself what I (or any WPA) could do with visualization today, it’s obvious that digitality offers affordances I didn’t have in my early career. Craig and Warnick’s chapter demonstrates how dynamic, interactive information visualization can connect vast amounts of qualitative and quantitative data, reconfigure and animate patterns, and modulate scale/perspective. Yet the relatively low-tech options chosen by the other authors suggests that this is not the whole story. Their network mapping is primarily a research method, which they admit may not always translate into persuasive visualization. The receptivity of stakeholders to particular visual genres plays into decisions about visualization, as do WPAs’ capabilities.
I want to think about my question from the perspective this book takes of “everyday administrative contexts” for visual rhetoric: especially, what we can expect of WPAs who may not be formally educated for the role or, at least, are untrained in visual rhetoric and/or digital design; who may work in contexts of limited time, budgets, and technological access; who may, like me, feel more verbally than visually (and technologically) abled.
As a WPA, I made visuals intuitively, largely unaware of an extensive visual vocabulary that could have expanded my repertoire: pre-digital genres like diagrams, charts, graphs, and technical drawings, each with their own visual conventions, contexts, and uses (Brasseur, 2003); or 2D geometric projections of multidimensionality (see Lefferts’s 2019 visualizations of structures, processes, and systems in a holofractal universe). Like most new technologies, digital mapping incorporates and builds on older visual forms (Martins’s maps), making them easier for everyday users to produce, even as it creates entirely new possibilities (Craig & Warnick’s network map). This suggests that WPAs today could benefit from familiarity with long-established visual genres, which can be executed at various levels of technological sophistication, and provide a basis for genre innovation.
However, I am wary of ratcheting up expectations for WPAs in everyday contexts as visual rhetoricians without taking into account the difficulties for them of learning these visual genres, accessing and mastering technologies for producing them digitally, and deploying them (as experts would urge) with critical awareness of their uses and limitations as genres. Most would be not only practicing, but learning—probably self-teaching—all this on the job, in less than ideal material conditions. As Suzanne Sink has noted in her born-digital dissertation (2019), digital design is an expertise developed over years of education and practice, and even technologically capable scholars can easily run into limitations of their knowledge in trying to execute their visions. All of us must depend on experts for instruction and collaboration. As jacks-of-all-trades, WPAs should be encouraged to cultivate design capabilities to a degree, and at a pace, appropriate to their abilities, needs, and conditions for learning, which could include workshops in practical visual rhetoric from field experts at conferences and online. Most important for WPAs is not a particular level of visual skill, but to understand and integrate image and word as symbolic means to enact their highly honed abilities to perceive, critique, and transform underlying social forms.
Notes
1. Now Department of Writing Studies, Rhetoric, and Composition.↩
2. The comprehensive strategic plan (October) completed a two-stage planning document; the earlier (March) analyzed the institutional and theoretical parameters for a design.↩
3. According to Brasseur, 2003, this is a structure/organization chart, not a tree diagram. The difference between Figure 5 (tree) and Figure 6 (braid) is between categorizing courses (a taxonomy) and relating them conceptually in a curriculum.↩
4. Written for Working Papers, an in-house publication, “New Basics” is included as an appendix in the strategic plan.↩
5. For a photo of "archaic lobed medallion carpet with turtles in the border," see Alexander (1993). Later a reader sent me a carved wooden model of the turtle universe.↩
References
Path 1. Mapping in/as Administration
04. WPA Responsive Genre Change
05. Diagram as Boundary Object
David Martins